GC / LC-MS visualization
This application enables the visualization and integration of GC / LC data with or without MS.
Introduction
GC-MS
Gas chromatography- mass spectrometry (GC-MS) is an analytical technique that combines gas chromatography and mass spectrometry to identify different substances within a sample. It allows analysis and detection of tiny amounts of a substance by separation of the substances with the gas chromatograph, then identification with the mass spectrometer.
First, the sample goes through the gas chromatograph. The different chemical compounds are separated according to their relative affinity for the stationary phase of a capillary column. The molecules come out of the column at different times (retention times) and therefore enter the mass spectrometer at different times. In the mass spectrometer, the molecules are broken into ionized fragments that are detected using their mass-to-charge ratio.
Different ionization techniques can be chosen, but the most common form is the electron ionization (EI). The molecules entering the mass spectrometer are bombarded with free electrons causing their fragmentation in a characteristic and reproducible way.
LC-MS
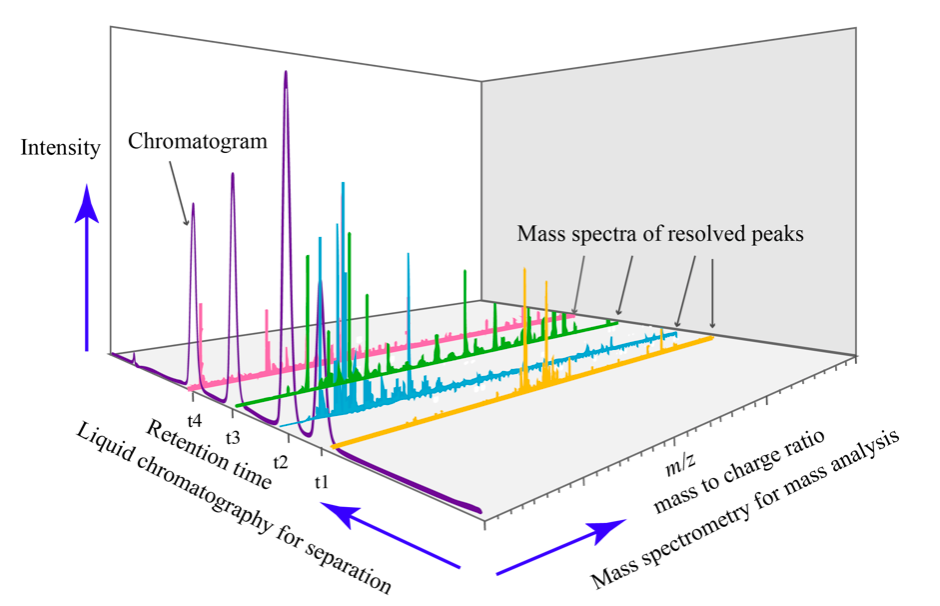
Liquid chromatography-mass spectrometry (LC-MS) is an analytical method that combines liquid chromatography with mass spectrometry. The principle of separation-identification is basically the same as GC-MS. Here however, the components are separated according to their affinity with both a stationary phase and a mobile phase.
A LC-MS spectrum looks like the following:
Overview
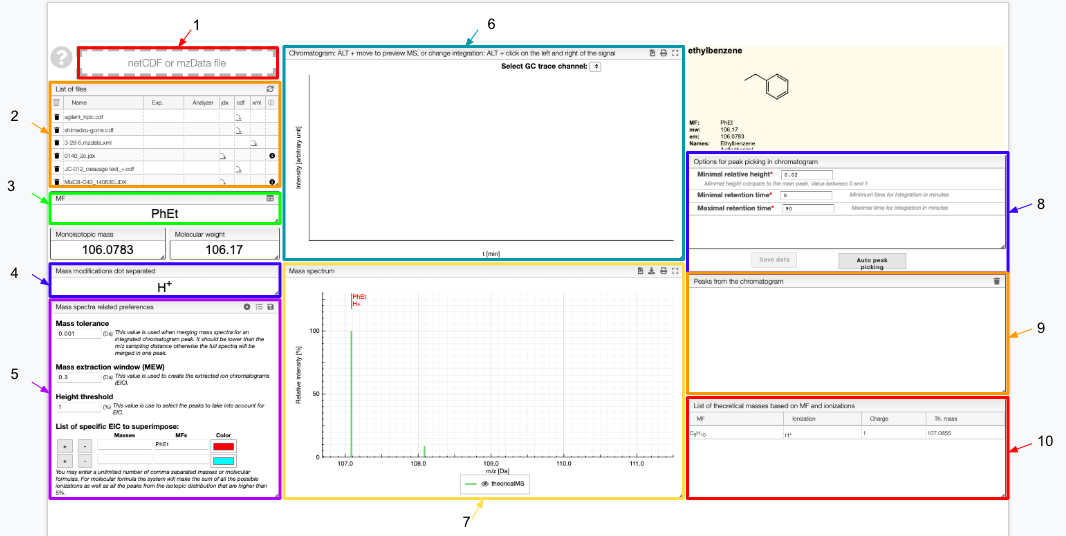
- Drag and drop your file
- List of the files: select one of them to display
- Molecular formula of your molecule
- Enter the ionization method(s) used
- Enter your preferences related to the mass spectra and save them
- Chromatogram
- Mass spectrum
- Options for the peak picking and auto peak picking
- Peaks extracted from the chromatogram
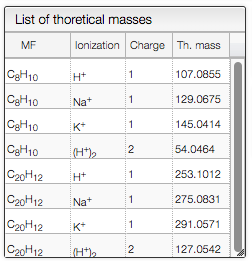
- List of theoretical masses based on the molecular formula and ionization method you entered
Loading files
Files can be uploaded either as a JCAMP, NetCDF, MzData, MzML or MzXML format. Multiple files can be drag and dropped or selected from your computer by clicking on zone 1. The files are listed below the drop zone and are visualized when clicked.
Information about the JCAMP-DX format.
How is a JCAMP-DX file structured.
JCAMP-DX file format
JCAMP-DX (Joint Committee on Atomic and Molecular Physical Data Exchange) is a standard file format for the exchange of spectra and related physical and chemical information between different spectrometers, databases or other systems.
The information is stored using ASCII characters and the file can be viewed, corrected, and annotated with a text editor. The spectra are stored as a table containing (x,y) coordinate pairs. Besides the data points, it is possible to store meta information and comments. The file extension is .jdx.
A JCAMP-DX document is composed of an unlimited number of Labelled Data Records (LDRs). Each LDR starts with a “##” and ends with “=”. Any space, comma, slash or hyphen is removed and the text is written with capital letters.
Some examples of Data Labels:
- TITLE : title of the experiment
- END : the last line of the file
- XUNITS : the units reported on the x-axis
- NPOINTS : number of points
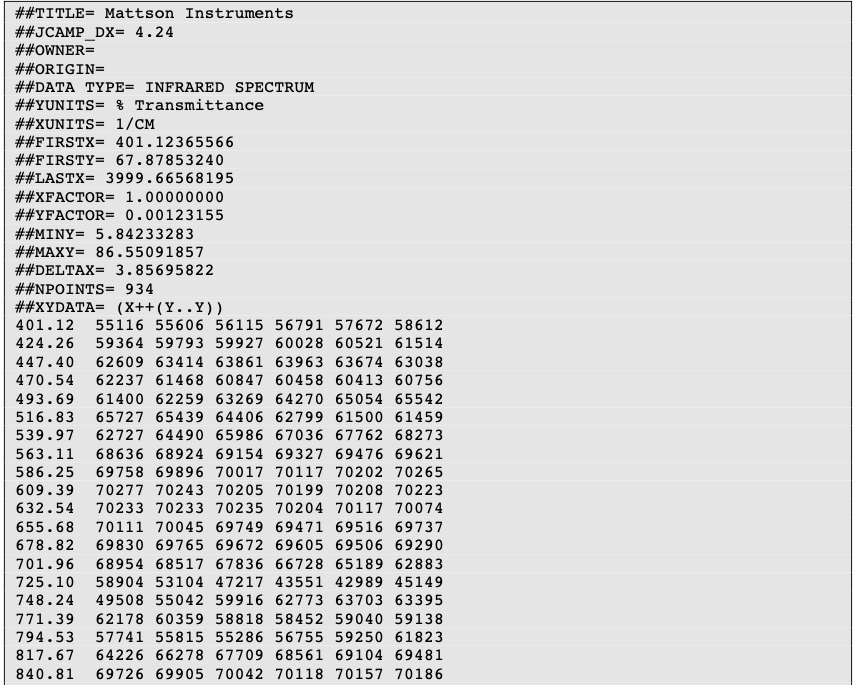
Two important LDRs are “XYDATA” and “PEAKTABLE”, which contain the spectral information. The former gives information in the form of a table where the first value in a line stands for an x coordinate and any subsequent values are y-coordinates with an equidistant increment on the x-axis. The latter provides information as a collection of (X,Y) pairs.
It is commonplace to compress the data tables. For instance, the table of numbers can be replaced by a line of characters (pseudo-digits). Among these pseudo-digits, there are PAC, SQZ, DIF, DIFDUP.
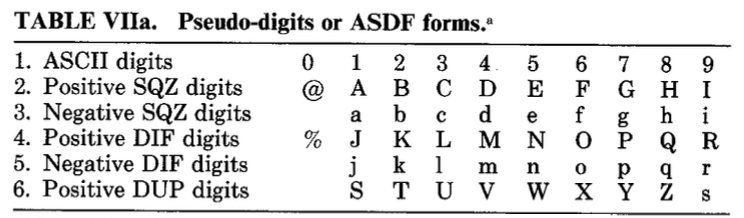
An example of compressed data using DIFDUP
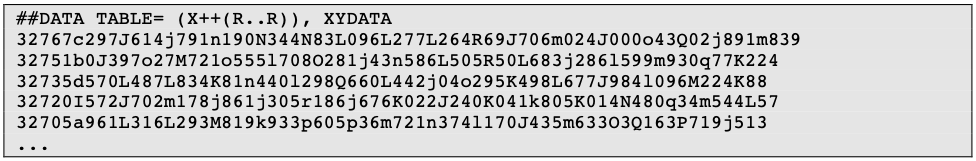
An in depth description is given in the original paper by McDonald and Wilks. Insofar as JCAMP-DX is a well-described and accessible format, it partially aligns with the FAIR (Findable, Accessible, Interoperable, Reusable) principles . It is interoperable and reusable. Provided that the user makes it findable and accessible, JCAMP-DX will fully comply with the aforementioned principles.
In the list of files, several icons appear:
 to remove a file from the list
  to download the resource file
  to get information about the spectrum
  to reload sample from the server. Caution: it will discard your local modifications.
Molecular Formula (MF) and mass modification
You can enter several molecular formulas by separating them with a dot as shown below.

For single formula, the monoisotopic mass and molecular weight are displayed below. For several formulas, the sum of the masses is displayed.
In order to calculate the theoretical masses you need to define the ion adduct. Many adducts can be defined at once by separating with commas. You may also define multiple charges.

All the possible masses (based on input formula and ion adducts) are displayed as a virtual green spectrum, and listed in the List of theoretical masses tab.
Mass Spectra Related Preferences
This section contains global settings for the manipulation of mass spectra and extracted ion chromatograms (EIC).
The mass tolerance is the tolerance used when merging mass spectra for an integrated chromatogram peak. If the distance between two peaks is below this critical value, the two peaks are merged into one single peak. The mass tolerance should be lower than the m/z sampling distance otherwise the full spectra will be merged in one peak.
The mass extraction window determines the minimum and maximum extracted masses for EIC based on the input m/z.
When entering a molecular formula the system will calculate the isotopic distribution and will combine the peaks that are closer than the mass extraction window. The peaks of the isotopic distribution that have a relative height over the height threshold will be considered and included in EIC.
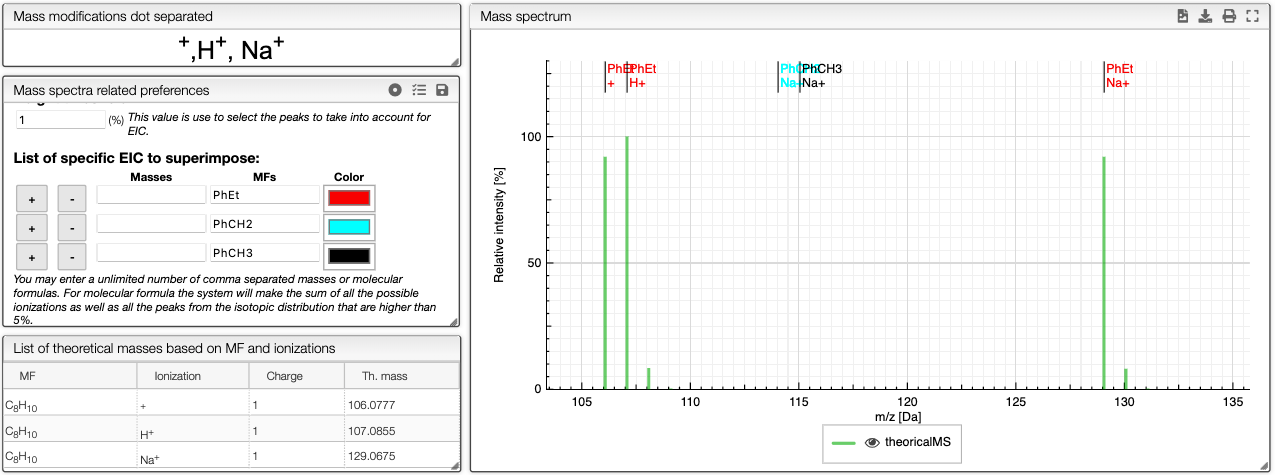
The list of specific EIC to superimpose can be used to manually input specific masses and formula for creation of EIC. You can enter an unlimited number of comma separated masses or molecular formulas. For molecular formula, the system will make the sum of all the possible ionizations as well as the peaks from the isotopic distribution that are higher than 5%. You can use this tool to visualize the amount of particular fragments or impurities present in your sample.
You can either enter a mass or a molecular formula and use ![]() and
and ![]() buttons to add or remove an element of the list. You may also change the color of each element.
buttons to add or remove an element of the list. You may also change the color of each element.
Your preferences can be saved in order to use them whenever you want. To do so, use:
 to save your preferences. Give it an easily identifiable name.
  to return to the default preferences.
  to reload previous preferences. All the preferences that you saved are stored and you can reload them whenever you want.
Chromatogram
Three GC trace channels are available:
- total ion current chromatogram (tic)
- base peak chromatogram
Select the one that you want on the top right of the chromatogram.
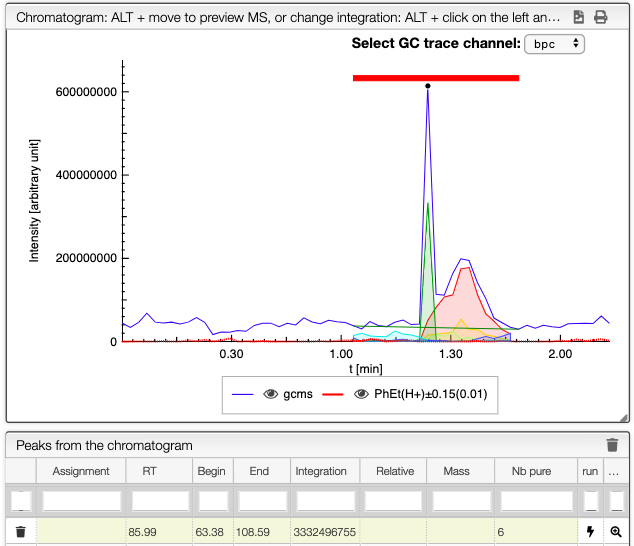
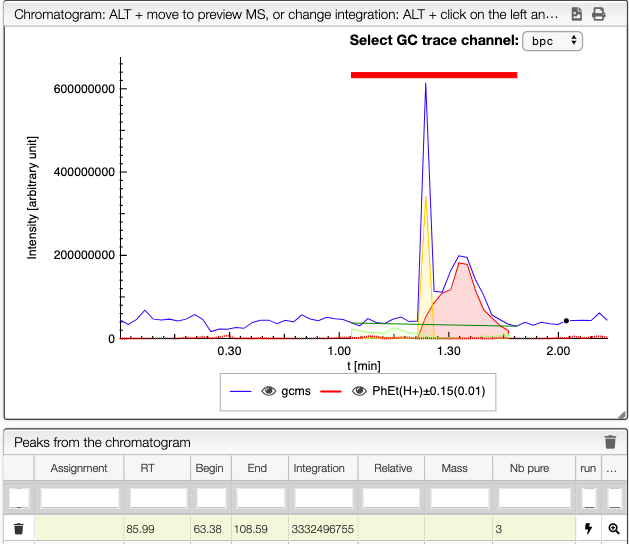
To integrate your peaks, you can either select auto peak picking, which will automatically recognize the peaks, or integrate by hand using ALT + click on the left and the right limits of your peak. The auto peak picking shows you the integration region and the identified peaks.
When several peaks are superimposed, you can use a deconvolution algorithm that will recognize the different peaks. It will suggest an ideal number of peaks, but you can change this number. The identified peaks will appear in different colors. See below the spectra obtained for different numbers of compounds in the same integration region.
You can download the chromatogram as a SVG file and print it using the two icons on the top right of the tab.
Mass spectrum
The mass spectrum tab displays the theoretical mass spectrum. The calculations consider the ionization method selected and the list of molecular formulas that you entered. The name of the species that appear in the spectrum are colored according to your choice in Mass spectra related preferences tab, and the ionization method is specified under each name.
The theoretical masses are gathered in a table under List of theoretical masses based on MF and ionizations.