Image analysis
This view allows you to annotate images and identify Regions of Interest on grayscale images.
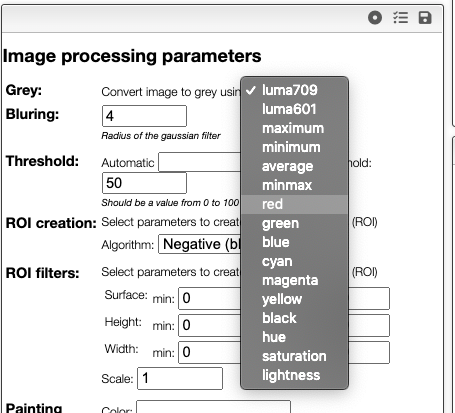
If the source is a color image, a first step will be to convert it to a grayscale image using one of the provided algorithms.
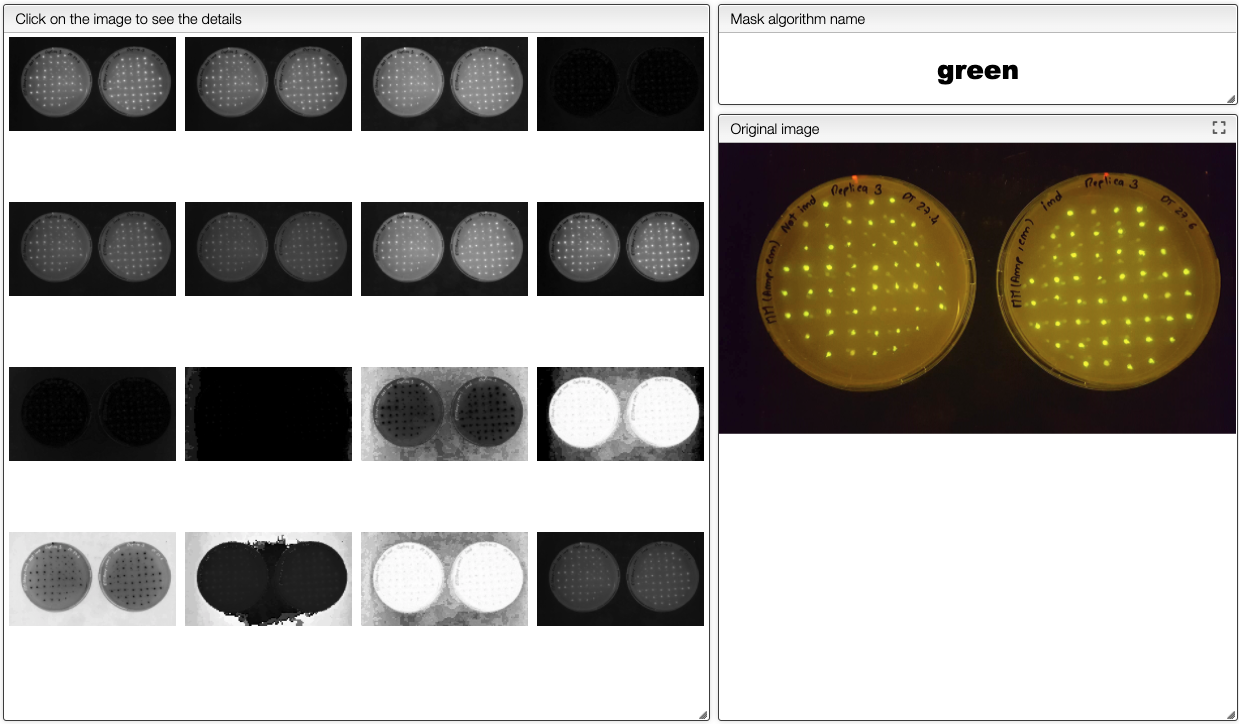
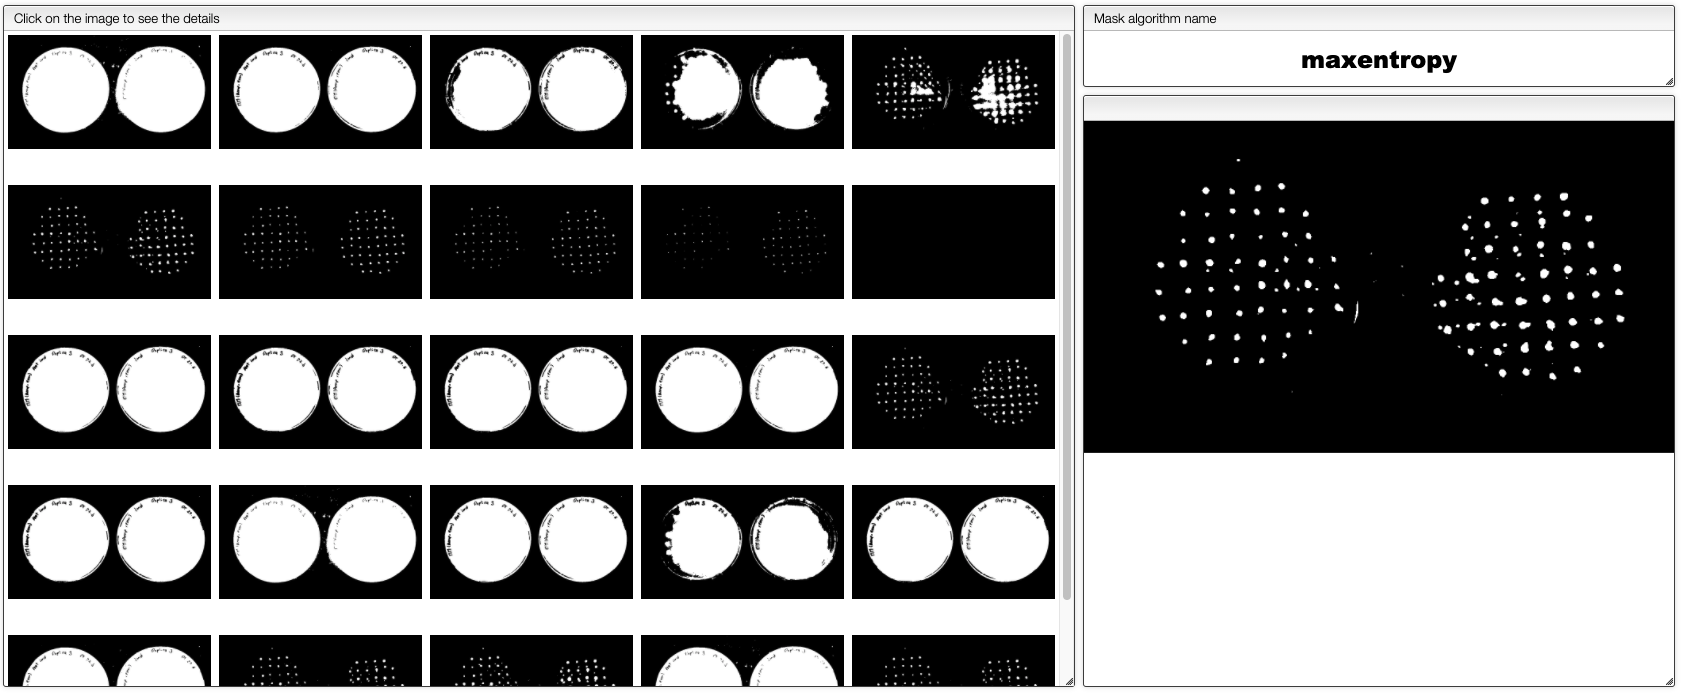
If you don't know which algorithm to use, you may click Explore greys. The system will reduce the size of the image and try all the available algorithms. You should then select the one that yields the highest contrast.
Example of Analysis of SEM / TEM images
The image coming out of the SEM microscope is expected to be in TIFF 16 bits. Apparently some software destroy the image to 8 bits when adding the scale.
There are 3 steps in order to process your image:
- The first step is to apply a gaussian filter to the image (blurring). Values of 4 to 8 seem reasonable.
- The second step will generate a mask. The white pixels are the 'positive' area while the black one negative. You may either select one of the provided algorithms or use the 'threshold' algorithm. In this later case the 'Threshold for mask' value will be taken into account. It should be a value between 0 and 100 (percent of white).
- Finally the third step is to create the Regions Of Interest (ROI). It is possible to define the minimal surface, positive / negative as well as the 'Scale' factor that will be applied to the ROI.
Creating the mask
In order to create regions of interest (ROIs) it is required to create a mask (a black and white image). Creation of the mask is based on the threshold that define the level of grey intensity that separates the white pixels from the black pixels.
This threshold can be determined automatically using one of the provided algorithm or it can be entered manually as a value between 0 and 100% if the algorithm stays unspecified.
In order to quickly evaluate which algorithms or threshold should be used you can click on Explore masks and select the more suitable threshold. This function requires that blurring has been applied before.
Creating and filtering ROIs
Once the threshold has been determined it is time to create the ROIs. 4 algorithms are available:
- Positive: the ROIs are white
- Negative: the ROIs are black
- Watershed: there are some ROIs that overlaps and we need to separate them. The ROIs are white
- Inverted watershed: same as Watershed but the ROIs are black
There is also the possibility to scale the obtained ROIs. This may be practical in order to get average color of a spot.
Painting the final image
The result of analysis can be graphically displayed on the original image and many options allow defining what should be displayed.
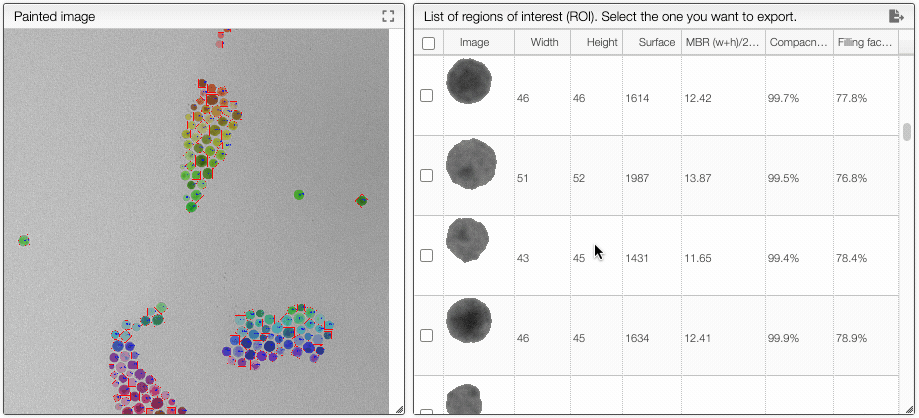
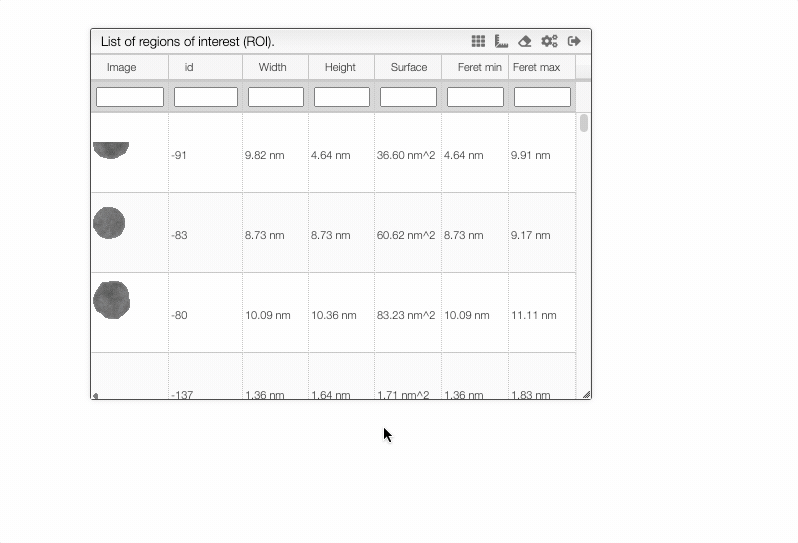
ROI Analysis
By clicking on the ‘ROI Analysis’ button you will have access to a table containing various parameters of the different ROIs.
Among other you will have access to the MBR (Minimal bounding rectangle). The ratio between the surface of the MBR and the surface of the ROI (Region Of Interest) is what we call the ‘filling factor’, 100% means a cube, a sphere should be π/4 (78.5%)
ROI Categories
If you click on ROI Categories you will be able to define categories based on characteristics of the ROIs.
This panel will also display an histogram that contains the different categories.
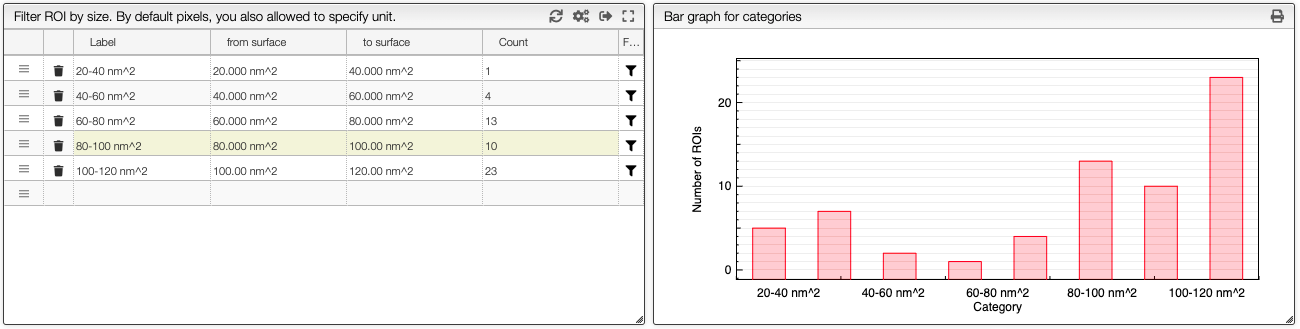
How to create ROI categories.
Create ROI categories
Region Of Interests (ROIs) can be grouped and counted in categories by clicking on the button ROI categories.
The criteria related to surface or length it is either possible to specify the minimal / maximal number of pixels or to specify the size with the unit.
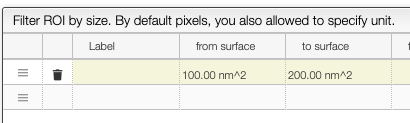
You may define an unlimited number of categories based on the available criteria. There is always a from / to range for each of the criteria.
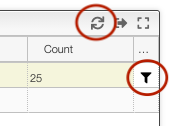
Checking a specific category
It is possible to display the ROIs belonging to a specific category by clicking on the filter icon. To come back to the full list of ROIs
you should click on the sync icon.
Save / Load preferences
From the 3 icons present on the top of the preferences window it is possible to:
- load the default preferences
- load saved preferences
- save the current preferences
This allows to store templates of preferences depending the kind of images you are processing.
Exporting data and table customization
It is possible to define the column you want to display / export as well as the format
If you wish to hide the units for import, there is the option to specify numeral: '0.00', hideUnit: true.
Other tips
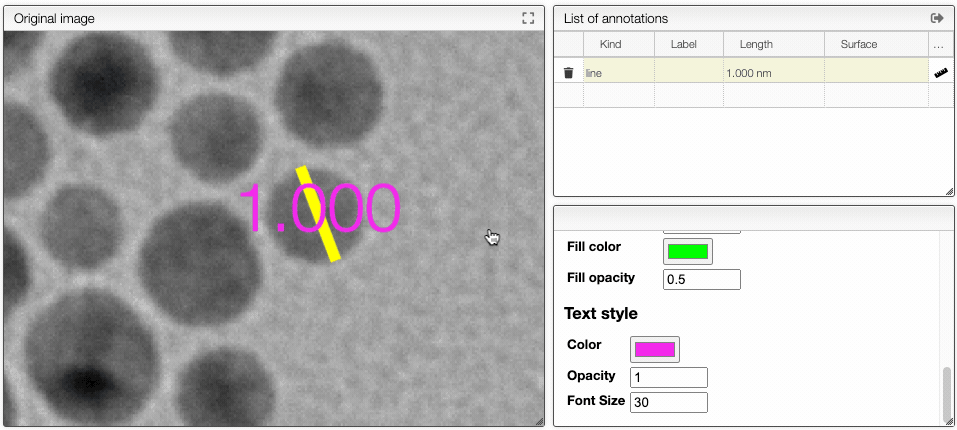
It is possible to annotate and measure images with lines and polygons.
Define pixel size
The image analysis tool allows you to draw lines and polygons directly on the image.
All the annotations will be saved with the sample back in the database.
Using annotations it is possible to determine the surface or length of some specific area of the image.
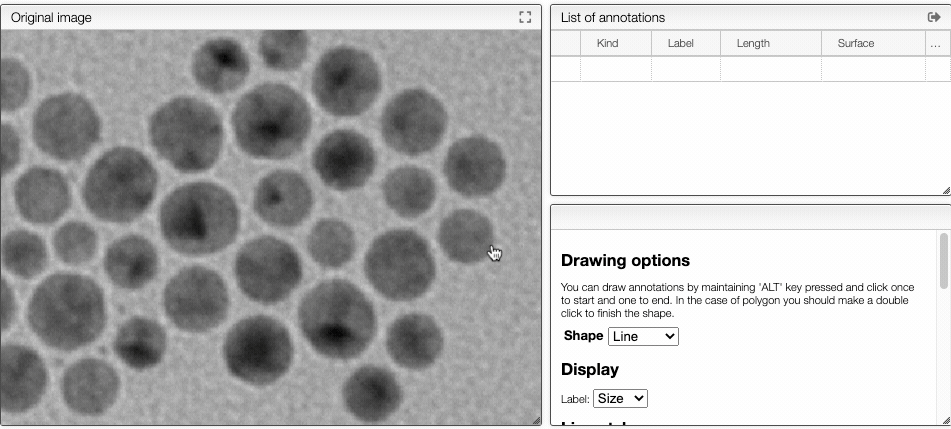
Drawing annotations
In order to draw annotations:
- for a
line: click once for the beginning of the line and another time for the end of the line - for a
polygon: click once for each corner of the polygon, click twice to end the shape.
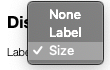
Display labels
It is possible to display labels either as custom text or as the value of the shape (length or surface).
Changing style
Style of the label and the shape can be customized according to the preferences. Opacity is a value between 0 and 1. 0 meaning fully transparent and 1 fully opaque.
Many parameters are calculated for regions of interest.
Information about ROIs
Many parameters characterizing ROIs are automatically calculated.
ROI
Region Of Interest (ROI) has various characteristics. Among them:
- Surface: the number of pixels in the ROI
- External: the number of pixels that touch at least one other external pixel
- Perimeter: ROI perimeter using cutting edge algorithm (see illustration)
- Diameter of a circle of equal projection area (DEQPC):
- Diameter of a circle of equal perimeter (DPED):

Calculation of perimeter of pixel based images is not a trivial topic. This has been reviewed in the literature.
In this tool we use the following approach:
- We count all the pixel sides that are outside the ROI (each side counts as 1)
- If a pixel has 2 external sides, we remove from the sum (2 - √2) = ~0.59
- If a pixel has 3 external sides, we remove from the sum 2 * (2 - √2) = ~ 1.17
This means that for each border pixel the contribution to the perimeter is:
- pixels with one external side: 1
- pixels with two external sides: ~1.41
- pixels with three external sides: ~1.83
Practically the shape of the perimeter is represented in the following image:

Minimum bounding rectangle (MBR)
A useful parameter for determining the shape of a ROI is the Minimum Bounding Rectangle (MBR), which represents the smallest rectangle that surrounds the ROI.
The MBR is characterized by:
- width: length of the longest side of the rectangle
- height: length of the smallest side of the rectangle
- perimeter: perimeter of the rectangle
- surface: surface of the rectangle

Convex Hull (CH)
The convex hull may be visualized as the shape enclosed by a rubber band stretched around the ROI. It is useful to estimate the compactness of the ROI.
Two parameters are available for the convex hull:
- surface
- perimeter

Feret diameters
The feret diameters of a ROI can be calculated using a virtual caliper. 2 diameters are calculated:
- min: the minimal size of the ROI that could be measured using a caliper
- max: the maximal size of the ROI that could be measured by a caliper
- ψA (Aspect ratio): ratio of the minimum to the maximum Feret diameter (0 < ψA ≤ 1), an indication of the elongation of the particle

Other parameters
Sphericity
The sphericity is the ratio of the perimeter of the equivalent circle, PPED, to the real perimeter, Preal. A perfect sphere has a sphericity of 1. The idea is that irregular shape causes an increase in the perimeter and therefore this ratio has a lower value. Knowing that the smallest possible perimeter for a given projection area is a circle, 0 < S ≤ 1.
Please note that the evaluation of perimeter is a complex topic and check above the approach that is used in this application. It is not impossible that the sphericity is slightly higher than 1.
Convexity
The convexity () describes the compactness of a particle. The convexity is the ratio of the projection area itself and the area of the convex hull. The maximum theoretical convexity is 1, if there are no concave regions. Due to the pixelation of images, all particles seem to have small concave regions, corresponding to the tiny steps with every pixel in the perimeter line. Therefore, the maximum convexity calculated in reality is mostly limited to 0.99.
Roundness
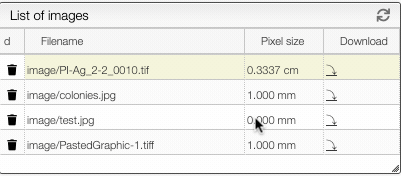
Pixel size can be defined manually or automatically.
Define pixel size
In order to know the size of ROIs or annotations it is important to define the pixel size.
In some case this information can be extracted from the meta information of the image. It can also be defined by the user using one of the 3 following approaches:
From the list of images
In the list of images you can directly double click on the pixel size and enter a value with the corresponding unit.
From the annotations tab
In the annotation tab you can click on the edit button on the top of the Pixel size box.
![]()
You can also draw a line and specify the length of the line. This will calculate automatically the size of a pixel.
Regions of interest may be selected before exportation.
Select ROIs for exportation
It is possible to select some region of interests (ROIs) to export either from the ROIs table by clicking the checkbox in the first column or by clicking on the ROI directly in the image.