1H prediction
This tool allows you to predict the 1H NMR spectrum of your sample or any other molecule.
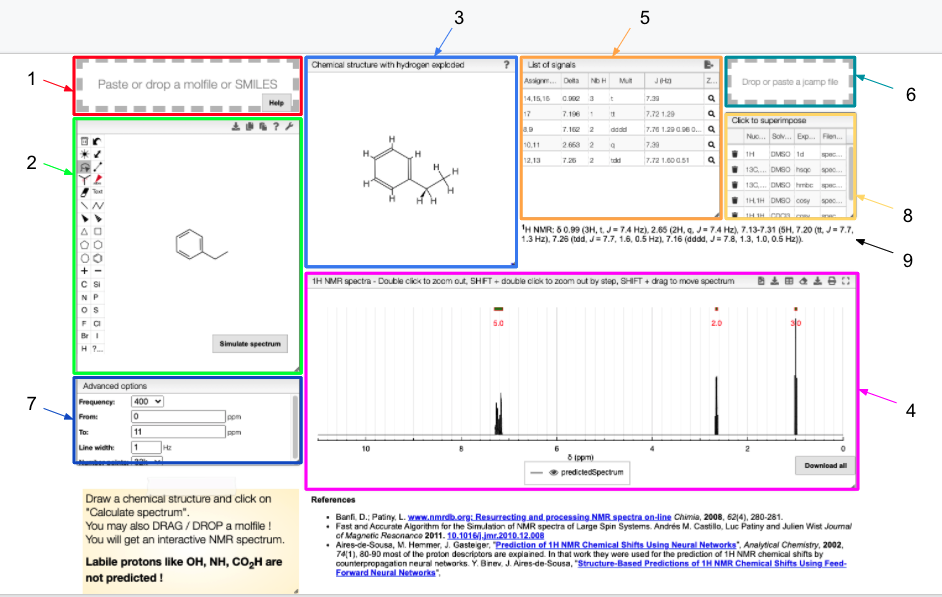
- Drag and drop module - paste a molfile or a SMILES string of a molecule
- Draw a chemical structure and predict module - draw the structure of the molecule
- Chemical structure with explicit hydrogens module - explicit representation of hydrogens in a molecule
- 1H NMR spectrum module - predicted 1H spectrum of the chosen molecule
- Signal module - list of obtained peaks and the corresponding chemical shifts
- Drag and drop module - paste a JCAMP-DX of an experimental spectrum for comparison
- Advanced options module - modify the magnetic field strength, specify the range of chemical shifts, change line width and the number of points to plot.
- List of spectra module - select which experimental spectra of the sample to superimpose on the predicted one
- Peak list module - list of peaks with corresponding chemical shifts, scalar couplings and multiplicity, ready for publication.
The structure of the currently selected sample will be already drawn so that you may go ahead and simulate its spectrum right away. If you wish to simulate the spectrum of another molecule, you can draw it or you can paste the structure in the form of a molfile or a SMILES string. Structure drawing is powered by JSME. You may also drop or paste a JCAMP-DX file to superimpose an experimental spectrum over the prediction.
How is a JCAMP-DX file structured.
JCAMP-DX file format
JCAMP-DX (Joint Committee on Atomic and Molecular Physical Data Exchange) is a standard file format for the exchange of spectra and related physical and chemical information between different spectrometers, databases or other systems.
The information is stored using ASCII characters and the file can be viewed, corrected, and annotated with a text editor. The spectra are stored as a table containing (x,y) coordinate pairs. Besides the data points, it is possible to store meta information and comments. The file extension is .jdx.
A JCAMP-DX document is composed of an unlimited number of Labelled Data Records (LDRs). Each LDR starts with a “##” and ends with “=”. Any space, comma, slash or hyphen is removed and the text is written with capital letters.
Some examples of Data Labels:
- TITLE : title of the experiment
- END : the last line of the file
- XUNITS : the units reported on the x-axis
- NPOINTS : number of points
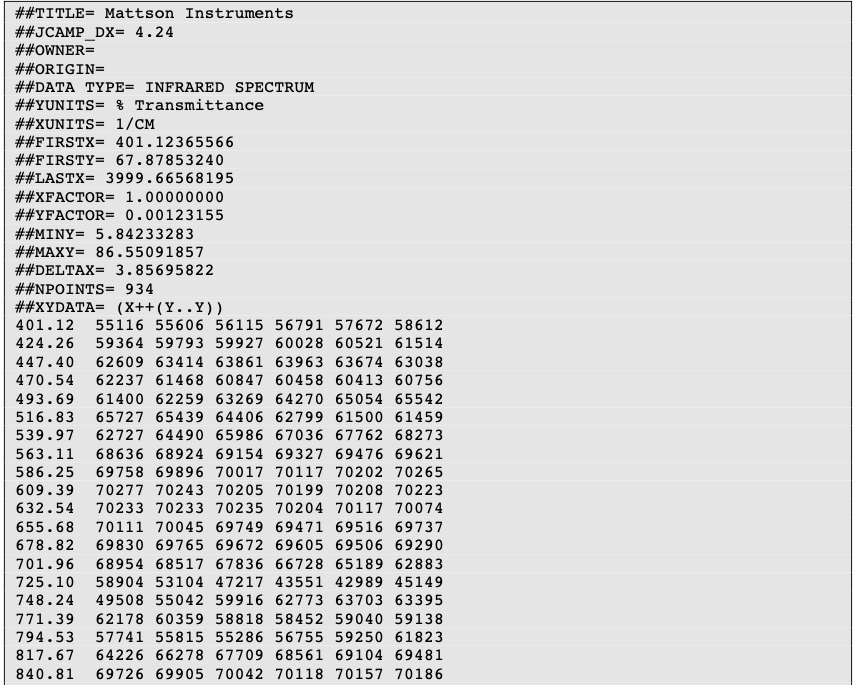
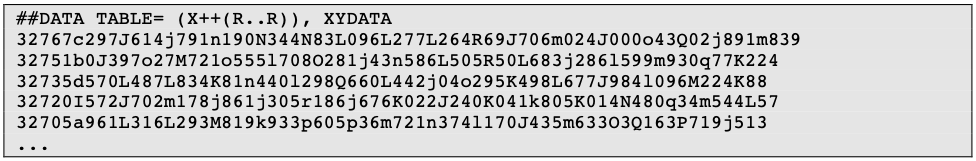
Two important LDRs are “XYDATA” and “PEAKTABLE”, which contain the spectral information. The former gives information in the form of a table where the first value in a line stands for an x coordinate and any subsequent values are y-coordinates with an equidistant increment on the x-axis. The latter provides information as a collection of (X,Y) pairs.
It is commonplace to compress the data tables. For instance, the table of numbers can be replaced by a line of characters (pseudo-digits). Among these pseudo-digits, there are PAC, SQZ, DIF, DIFDUP.
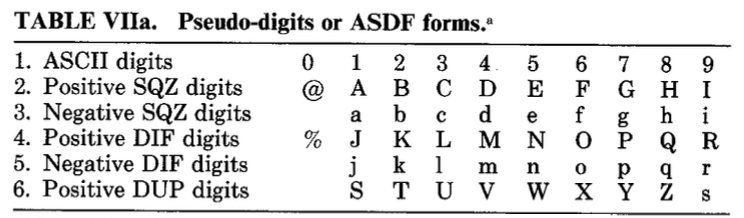
An example of compressed data using DIFDUP
An in depth description is given in the original paper by McDonald and Wilks. Insofar as JCAMP-DX is a well-described and accessible format, it partially aligns with the FAIR (Findable, Accessible, Interoperable, Reusable) principles . It is interoperable and reusable. Provided that the user makes it findable and accessible, JCAMP-DX will fully comply with the aforementioned principles.
The simulated spectrum, the chemical structure with explicit hydrogens and the list of peaks modules are linked, so that hovering over an entry in the list will highlight the corresponding atom in the structure and the relevant peak in the spectrum. Furthermore, the predicted spectrum is reported in the publication ready form (with chemical shifts, scalar couplings and peak multiplicity).
In the advanced options, you can adjust the parameters of the simulation. With frequency you can specify the strength of the magnetic field. Furthermore, you may adjust the range of chemical shifts in which to perform the simulation. Linewidth and number of points specify the peak width and the number of data points to simulate, respectively.