X-ray photoelectron spectroscopy (XPS)
XPS is a surface-sensitive spectroscopic technique which allows for the assessment of the elemental composition of a material's surface as well as the elements chemical state. Also the electronic structure and density of the electronic states of the material can be determined. XPS is often used for the study of chemical reactions or the assessment of novel structures as it shows which elements are present in a particular material and which elements they are bonded to.
XPS is a technique based on the photoelectric effect, where an X-ray beam hits the material and electrons escape from the surface. These emitted photoelectrons reach then an electron energy analyser, which measures the kinetic energy, as well as a detector that counts the number of electrons.
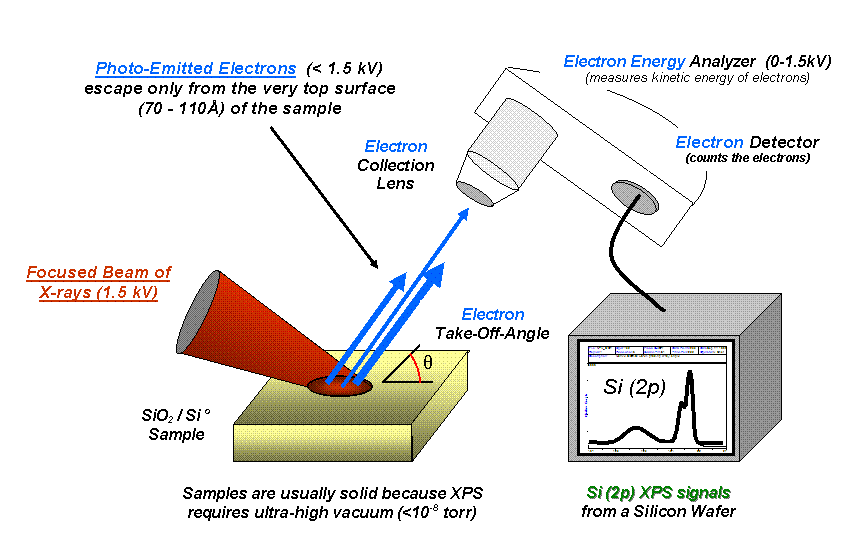
The data obtained corresponds to a spectrum in which the number of electrons are plotted as a function of the specific binding energy [eV] at which they were detected. Each element of the periodic table gives rise to a specific set of XPS peaks which also determines the electronic configuration (e.g. 1s, 2s, 2p, etc.). Similarly, the number of electrons corresponding to each peak is associated to the amount of that particular element within the XPS analysed sample.
Analyze Window
In this view, it is possible to drag and drop XPS files (vms files). Every sample usually has a list of spectra associated with it, typically including a wide scan and several individual orbitals. Each spectrum can be visualized by clicking on the name of the file in the list of XPS files.
Wide scan
By zooming in on individual peaks in the wide scan, a list of possible orbitals and their corresponding binding energies are filtered in the "List of reference values"
Compare Window
Orbital energies of different samples can be compared in the "Compare" view. In the "List of selected entries", a sample can be searched for by entering the product/sample code in the search box. By clicking on a sample, a list of spectra for different orbital energies appears in the "List of XPS files" below. By clicking on one of these files, the spectra are displayed and the file is listed in the "List of displayed spectra". Note that it is advisable to compare only charge-corrected samples in this way, since otherwise chemical shifts cannot be compared.
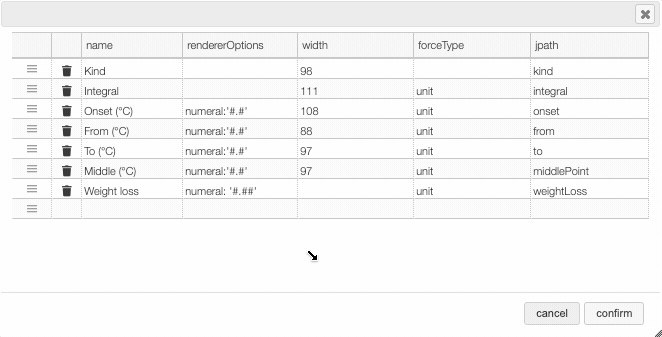
In many tables it is possible to select which columns to display. This is achieved by clicking on the icon.
After clicking on the icon, a dialog box opens that allows you to add a new column.
There are 5 parameters to fill in for a new column:
- name: the column name. This will be displayed as the header of the column.
- rendererOptions: options that allow you, among other things, to format numbers. One very useful formatter is
numeral(see below) - width: number of pixels for the specific column. May stay empty for automatic layout.
- forceType: select how to display complex values (see later)
- jpath: where to find the information to display in the column
To add a new column, you need to select the jpath using the hierarchical drop-down menu.
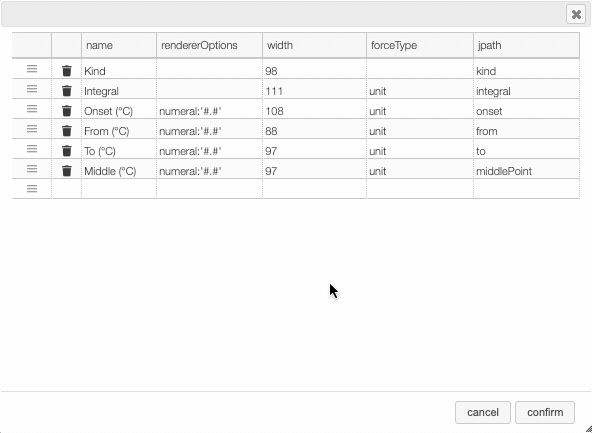
Columns can be moved or rearranged as well.
rendererOptions: numeral
number,
| Value to format | rendererOptions | Result |
|---|---|---|
| 12.345678 | numeral:'#.##' | 12.34 |
| 12.3 | numeral:'#.00' | 12.30 |
| 0.3 | numeral:'#.0 %' | 30.0 % |
forceType
In the database some values are stored as an object that needs to be displayed to the user in an intuitive way.
For example the unit type will store in the database the value using as units SI (we convert the data to the units defined by the 'standard international') and specify in which units the user would like to display the data. So in the following example we are in fact storing the value -150°C by storing the value in SI (Kelvin) and specifying that the user wants to see it in °C.
{
  "SI": 123.15,
  "unit": "°C"
}
Another example is the valueUnits type that will store the data in 2 different properties
(value and unit). In this case the value is stored in the specified units and there is no conversions.
{
  "value": 123,
  "units": "°C"
}
While this way to store the data in the database is very practical it is not the way that the user would like to see his results. We have therefore the possibility to forceType: define how the user would like to see the results.
Other types include mf. This formatter allows to correctly display a molecular formula that is stored in the database as "C10H20O3". i.e. it will put the numbers in subscript (C₁₀H₂₀O₃).