Thermogravimetric analysis
Thermogravimetric analysis (TGA) is a technique often used for the assessment of physical phenomena of a sample (e.g. phase transitions, absorption, adsorption and desorption) as well as chemical phenomena (e.g. chemisorption, thermal stability, among others). During the measurement, the temperature is gradually increased, and the sample mass is continuously recorded over time. The data is collected and provided as a graph, in which the mass or percentage of initial mass is plotted as function of time or the furnace temperature. A typical thermogravimetric instrument possesses a precision balance with a sample holder located inside the furnace, whose temperature can be regulated with a controller. The measurement can occur under several conditions, such as: ambient air, inert atmosphere, oxidizing/reducing gases, corrosive gases, carburizing gases as well as vacuum or high pressure or constant or controlled pressure.
This module allows visualizing and processing TGA curves. You can upload txt files and jcamp files.
Upload
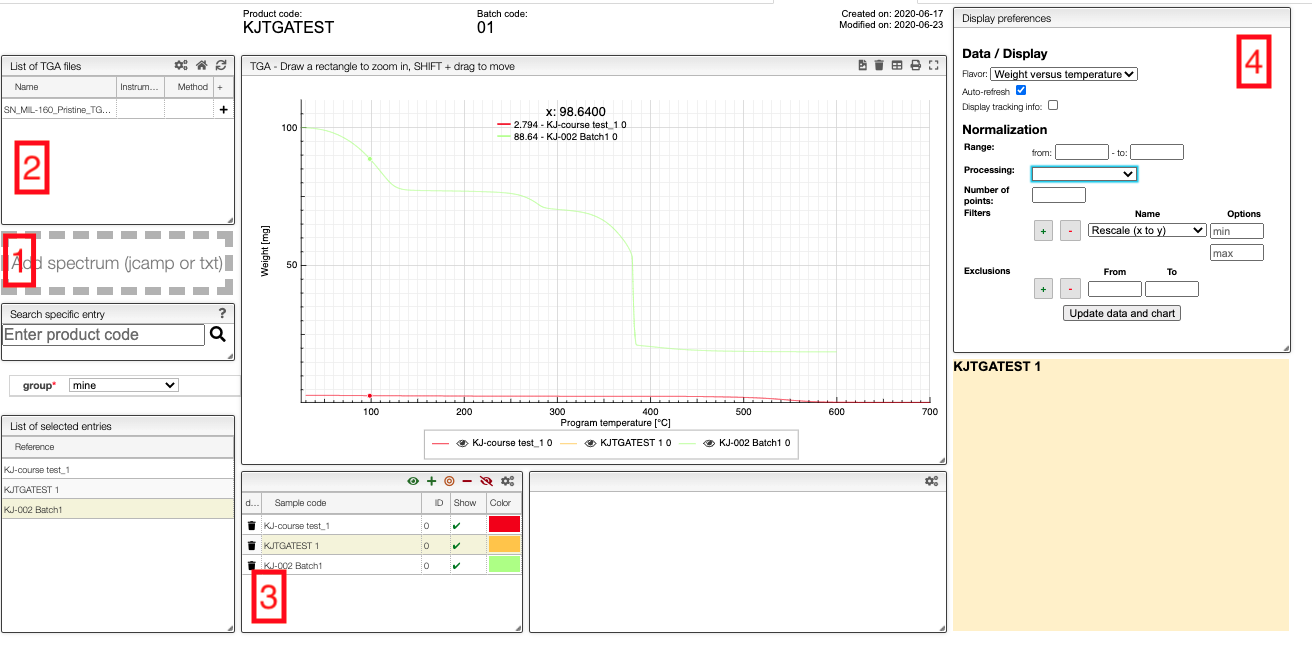
Files can be uploaded either by drag-and-drop to the field on the left-hand-side (1 in the image) or automatically from the instrument. The files will appear in field 2. Note that you can only upload files to samples to which you have write access.
Visualization
To add patterns to the visualizer, click on the + in field 1. The sample will then appear in field 3 from which you can control the visualization settings.
If you click on the color in a row, you can select any color you wish for the line, and you can use the control buttons in the top right corner of field 3 to control which figures you show in a spectrum.
In the chart you can draw a rectangle to zoom and double click to reset. You can move the graphs by pressing SHIFT ⇧ while dragging them.
Currently, we can display weight vs. temperature and weight vs. time. A percentage-weight-loss view is currently being implemented.
Processing
Field 4 gives you some basic processing tools.
- Units: select if you plot
Weight [mg] versus temperature [°C]orWeight [mg] versus time [s] - Display tracking info: display information about the position of the mouse
Normalization
- Range: select the min / max X value to display
- Processing: display either the normal spectrum, first derivative or second derivative
- Number of points: reduce the number of points in the spectra. This is a nice feature that allows to align the spectra on the 'x' axis but can only be used if the spectrum is monotone!
- Filters: various filter allowing to process the data. By default, the
Divide by max Yfilter is applied and allows getting as max Y value 1. - Exclusions: define zone that should be ignored during processing.
In many tables it is possible to select which columns to display. This is achieved by clicking on the icon.
After clicking on the icon, a dialog box opens that allows you to add a new column.
There are 5 parameters to fill in for a new column:
- name: the column name. This will be displayed as the header of the column.
- rendererOptions: options that allow you, among other things, to format numbers. One very useful formatter is
numeral(see below) - width: number of pixels for the specific column. May stay empty for automatic layout.
- forceType: select how to display complex values (see later)
- jpath: where to find the information to display in the column
To add a new column, you need to select the jpath using the hierarchical drop-down menu.
Columns can be moved or rearranged as well.
rendererOptions: numeral
number,
| Value to format | rendererOptions | Result |
|---|---|---|
| 12.345678 | numeral:'#.##' | 12.34 |
| 12.3 | numeral:'#.00' | 12.30 |
| 0.3 | numeral:'#.0 %' | 30.0 % |
forceType
In the database some values are stored as an object that needs to be displayed to the user in an intuitive way.
For example the unit type will store in the database the value using as units SI (we convert the data to the units defined by the 'standard international') and specify in which units the user would like to display the data. So in the following example we are in fact storing the value -150°C by storing the value in SI (Kelvin) and specifying that the user wants to see it in °C.
{
  "SI": 123.15,
  "unit": "°C"
}
Another example is the valueUnits type that will store the data in 2 different properties
(value and unit). In this case the value is stored in the specified units and there is no conversions.
{
  "value": 123,
  "units": "°C"
}
While this way to store the data in the database is very practical it is not the way that the user would like to see his results. We have therefore the possibility to forceType: define how the user would like to see the results.
Other types include mf. This formatter allows to correctly display a molecular formula that is stored in the database as "C10H20O3". i.e. it will put the numbers in subscript (C₁₀H₂₀O₃).