OctoChemDB - MF and structure from mass spectra
OctoChemDB: MF / structure from mass spectra
This very generic tool tries to identify molecular formulas and possibly chemical structures from mass spectra. It can deal with completely unknown products, for which the elements that compose the molecule are unknown, to products for which the range of molecular formulas is known.
In the case of unknown products, the tool will rely on OctoChemDB, a database created specifically to retrieve information on compounds from the monoisotopic mass.
What is OctoChemDB ?
OctoChemDB combines 10 databases available for free on the internet and indexes them based on the chemical structure (without stereochemistry). It is then indexed based on the molecular formula and monoisotopic mass. From the monoisotopic mass it can then retrieve all related information like available experimental spectra, taxonomy, biological activity, PubMed articles and patents.
The following 10 databases are combined on a regular basis.
A public API is available on: https://octochemdb.cheminfo.org/documentation/ and the GitHub repository is available here.
You can check here the status of the aggregation database.
Homepage
This tool is used to determine the molecular formula based on the monoisotopic mass.
Importing spectra (Drag and Drop)
Experimental spectra can be imported into OctoChemDB using the drag-and-drop area located at the top of the Homepage. The drop zone is labeled “Drop or Paste a TXT file” and accepts plain text (.txt) files containing mass spectrometry data.

Spectra can be provided either by dragging a file into the drop zone or by pasting the content of a text file directly from the clipboard. Both MS1 and MS2 spectra are supported, and the data can be provided either as profile spectra or as centroided (picked peak) data. Once imported, the spectra are displayed in the List of spectra panel and can be selected for subsequent analysis.
List of spectra
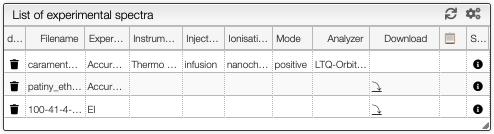
On the middle top panel, you can see the list of the imported experimental spectra. Each spectrum has a description if the data are available. You can see the type of resolution (either high or low resolution), the instrument used, the ionisation method and the analyser. It is also possible to download the data file and see the meta data associated.
Preferences
Entering a monoisotopic mass
When loading an experimental spectrum the tool will automatically make a peak picking (centroid) that will be displayed on the spectrum.
Zooming in the spectrum will progressively add more and more detailed peaks.
If you are searching the molecular formula of an unknown product you should click on the label corresponding to the monoisotopic experimental mass.
It is possible to search for many monoisotopic masses at once. Simply SHIFT + click on other labels in order to have a comma separated list of monoisotopic mass.
Molecular formula from monoisotopic mass
This tool allows finding possible molecular formula for a specific observed monoisotopic mass. When the elements are part of H, C, O, N, F, Cl, Br, I, Si, P and O the monoisotopic mass corresponds to the peak of the isotopic distribution that has the lowest mass.
However, by mass we don't observe a monoisotopic mass directly but always of a charged form. The molecule may be charged positively, negatively, multicharged or also modified by the addition of protons or other charged entities.
This tool will consider the mass of the electron and the number of charge of the molecule.
Ionizations
In order to observe a neutral molecule the mass spectrometer will charge it using different techniques. This may involve adding protons, remove electrons, etc.
You can also observe charged molecules resulting of the addition of Na+, K+, etc.
In order to evaluate all the possibilities you must enter in the 'ionizations' field a comma separated list of all the allowed ionizations.
You may as well specify multiple charges. Here are some examples of allowed patterns:
- H+ (addition of a proton)
- H+, Na+, K+ (either a proton, sodium cation or potassium cation)
- H+, (H+)2, (H+)3 (addition of one, two or three protons)
- (H+)-1, (H+)-2, (H+)-3 (removal of one, two or three protons)

It is also allowed to enter range of ionizations like
- (H+)1-5, adding between one and five protons
- (H+)-1--5, removing between one and five protons :::
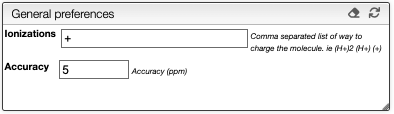
Accuracy and charge
You can specify the accuracy in ppm and the charge of the target molecule using the corresponding input box.
![]()
Range of atoms and groups
If some information about the molecule is known, you can specify it in the Range input. The allowed syntax is given below.
Possible syntax for range specification of atoms and groups.
It is possible to specify the range of atoms and groups in a powerful way.
First, you can specify the range of atoms using the syntax: <atom letter><minimum>-<maximum>.
For example, if we know that there are between 0 and 50 carbon atom and between 0 and 100 hydrogen atom, we can type : C0-50 H0-100
Note that the space represent a
ANDoperator.
You can also use group specification with the same syntax as atoms: <group abbreviation or molecular formula><minimum>-<maximum>.
For instance, if we know that there are between 0 and 2 (CH2CH2) groups, we can write : (CH2CH2)0-2
Moreover, in order to be more intuitive for a chemist, we can also write known abbreviation like Me, Bu, Boc...
The icon on the top of the panel show the list of the possible groups abbreviations.
You can also specify isotopes, such as [13C]0-10 for example.
Filter by degree of unsaturation
The result can be further filtered by the degree of unsaturation.
For stable molecules the unsaturation degree is expected to be greater or equal to zero. Moreover, if it is non-radical molecule the unsaturation degree is integer.
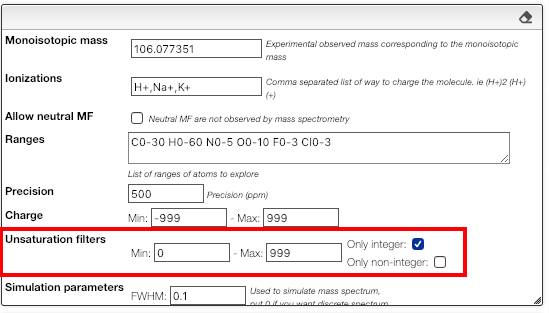
Please note that those filters apply on the molecular formula without the ionization.
Advanced filtering
Based on a variable entry that has the following structure:
{
  "em": 588.19603227909,
  "unsaturation": 1.5,
  "mf": "C14H34N7O18",
  "charge": 0,
  "ionization": {
    "mf": "(H+)2",
    "em": 2.01565006446,
    "charge": 2
  },
  "atoms": {
    "C": 14,
    "H": 34,
    "N": 7,
    "O": 18
  },
  "groups": {},
  "ms": {
    "ionization": "(H+)2",
    "em": 295.1052925918659,
    "charge": 2,
    "delta": 0.02253940813409372,
    "ppm": 76.37751236561516
  }
}
You need to return true or false. You are allowed to use all the javascript programming language.
Examples:
if (entry.atoms.C < entry.atoms.N) return true;
:::
return entry.atoms.N % 2 === 0;
if (entry.ms.em > 300 && entry.charge === 1) return true;
if (entry.ms.em < 300 && entry.charge === 2) return true;
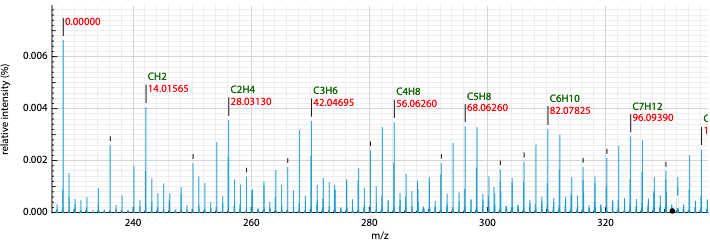
Relative mass and MF determination
This view displays normally the mass of the peaks, but it is also possible to display relative mass to a specific peak.
- Click on a peak to change the
Monoisotopic massvalue - Click on the checkbox
Relative masson the top right
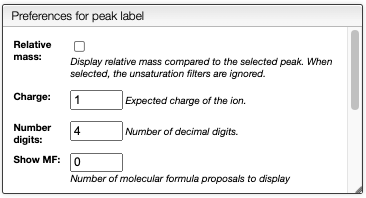
It is also possible to display possible molecular formulas for the relative mass. These are calculated using the following criteria:
- allowed atoms are based on the
Ranges - only neutral losses are considered
- the charge of the entity losing this neutral fragment is defined in
Charge, by default 1 - you should change the number in the cell
Show MFin order to annotate the peaks with the corresponding MF
It is also possible to define the color of the MF annotation depending on the precision. By default, if no MF is found under a precision of 20ppm no MF is displayed.

Results table
This tool calculates on-the-fly the possible molecular formula based on a monoisotopic mass and possible ionizations.
The resulting table will contain green background lines if this molecular formula exists in PubChem. This is an excellent way to find plausible molecular formula of unknown products.
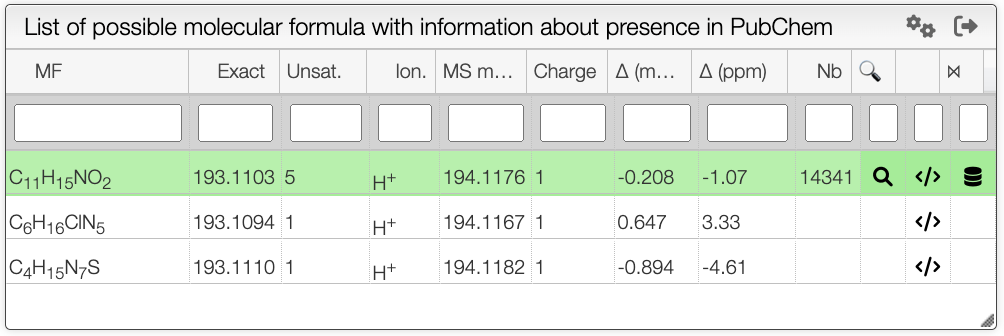
The results contain various columns:
- the NON-IONIZED molecular formula
- the monoisotopic mass of the NON-IONIZED molecule
- the unsaturation degree
- the ionization
- the observed mass
- the total charge (with ionization)
- the error in mDa
- the absolute value of the error in ppm
On the right of the results table you have the possibility to show the registered Pubchem molecules by clicking on the ![]() icon. There is also a way to find more about the Pubchem candidates by clicking on the search icon
icon. There is also a way to find more about the Pubchem candidates by clicking on the search icon ![]() , this button will redirect you to the Pubchem panel.
, this button will redirect you to the Pubchem panel.
Moreover, it is possible to search molecular formula that are included in the original molecular formula. To do this, click on the ![]() icon. Depending on what was defined in the
icon. Depending on what was defined in the preferences for peak label panel, this tool will show the possible molecular formula for each peak. You can choose the range of atoms in the molecular formula that you want in the preferences panel.
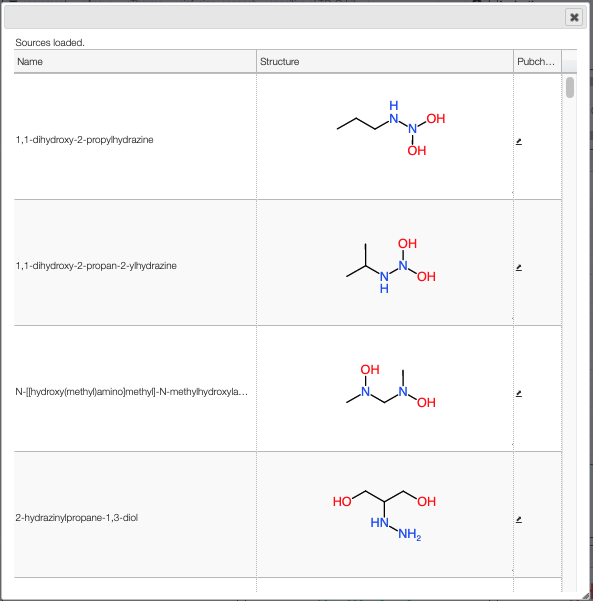
Pubchem candidates
Using the Pubchem candidates button you can list all possible molecular formulas that yield the desired monoisotopic mass with the defined precision. The right column will redirect you to the corresponding PubChem web page.
A few points to note:
- PubChem does not provide the isotope information in the molecular formula
- PubChem does not provide the different parts of the molecule in the molecular formula
- PubChem is not consistent with the monoisotopic mass they list on their website
Therefore we have recalculated the molecular formula, monoisotopic mass, charge and molecular weight from the provided molfile. This allows us to have very accurate monoisotopic mass that also deals with isotopes.
Please note that for the calculation of the monoisotopic mass we did not consider the charge.
NB: only stable isotopes are considered!
Tips
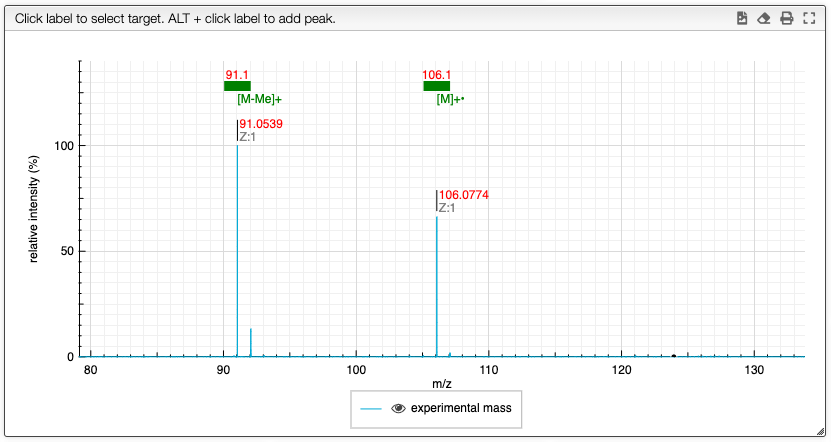
It is possible to assign the different fragments.
Assign mass spectrum
It is possible to assign mass spectra by ALT + click on a peak mass value. If the value does not appear you need to zoom before on the peak.
In the table you can double-click in the assignment column to enter the corresponding value.
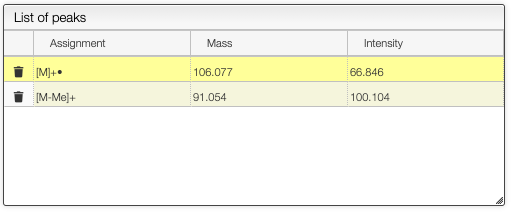
You will obtain a spectrum with annotations on the top:
In order to improve the MF determination it is possible to compare the full isotopic distribution.
Isotopic distribution similarity
Searching by monoisotopic mass allows you to quickly find possible molecular formulas, but there is much more information in the isotopic distribution.
The tab Similarity will calculate the match between the predicted
and experimental isotopic distribution for the specified Zone.
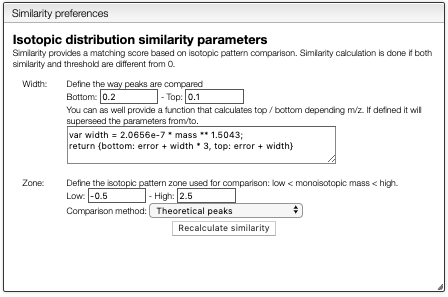
Peak width will be calculated automatically based on the experimental spectrum and the formula is expected to be good. However, the similarity calculation depends on the mass precision and this parameter has to be setup correctly. If the system cannot calculate correctly the relation between the width and the mass, it is possible to set it manually using the corresponding boxes.
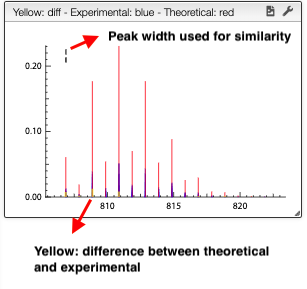
Clicking on one of the result will compare the theoretical versus the experimental isotopic distribution.
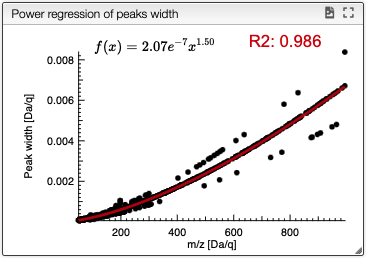
Info
The simulated spectrum is calculated using a regression of the width of the peaks as a function of the mass.
PubChem
This tool allows you to find a molecular formula, even if the range of atoms that compose the molecule is unknown. A few assumptions are made: the charge of the non ionized molecule is null, there are at least 5 molecules that have the same MF and the molecule does not break apart.
When the spectrum is loaded, you can click on a peak and the system will show a list of the possible molecular formula for a given ionization and accuracy. On the table you can see in green the molecular formula that are registered in the PubChem database. If you click on a formula, you can see at the right the list of isomers. In the draw panel, you can make a substructure search or a name search within the list.
In the table you can also see the number of natural product (Nat) and bioactive (Bio) molecules with the same molecular formula. If you click on the ![]() icon, you can see a table with the publication in PubMed related to the natural or bioactive product. Moreover, using MeSH terms, you can filter the results in the search bar at the top.
icon, you can see a table with the publication in PubMed related to the natural or bioactive product. Moreover, using MeSH terms, you can filter the results in the search bar at the top.
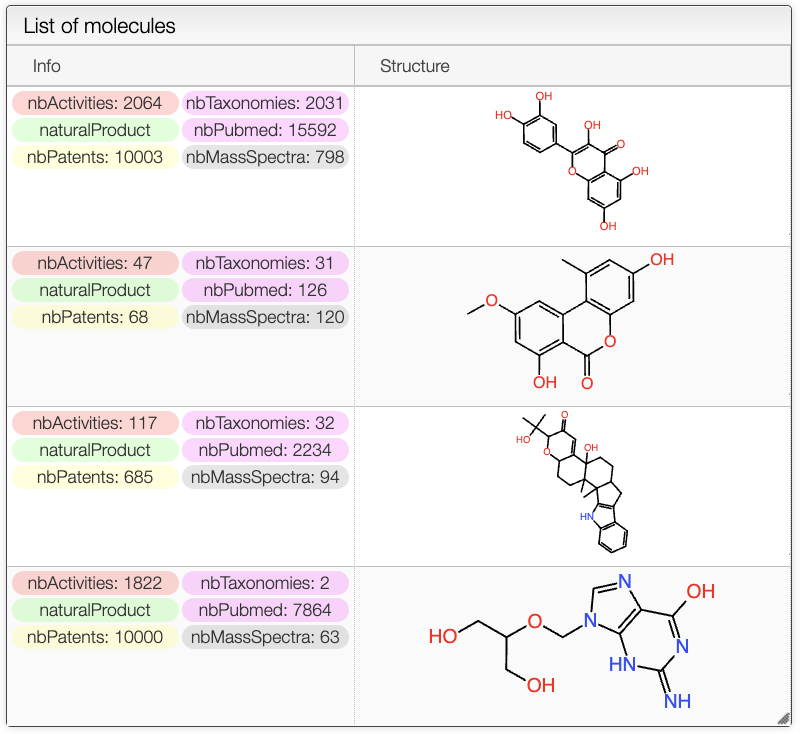
Search Results
The results of the search are displayed in a table. The table includes the structure of the compounds as well as tags such as the number of taxonomies, activities, patents, mass spectra... It also shows if the compounds is a natural product or not.
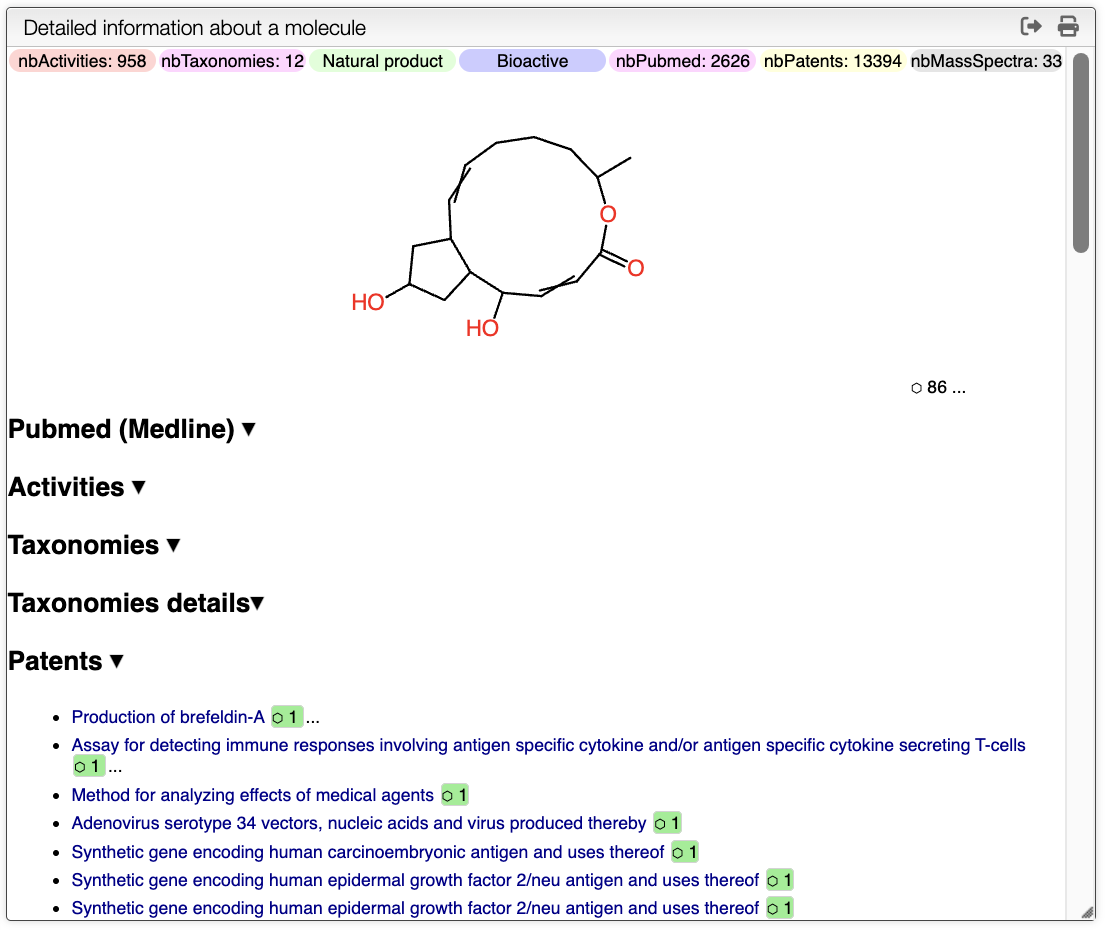
Compound Page
On the Detail information panel, you can find more information about the compound. On the top of the panel, there are the tags associated with the number of mass spectra, number of patents... Below, there is the structure of the compound without stereochemistry, the number on the right indicates the number of stereoisomers found in the database. By clicking on it, you will find all the structures as well as where it comes from.
Pubmed (Medline): In this section, you will find all the publications associated with the compound. By clicking on the title of the publication, you will be redirected to the Pubmed page. The number on the right of each title indicates the number of times that this compound has been described in the publication. A green color indicates that the publication can be interesting. This allows the user to quickly find the most relevant publications. The three dots next to the number allow the user to see the abstract of the publication. The abstract includes the mesh terms.
Activities:
Activities show additional details on the activities of the compound. It includes Superkingdom, Kingdom, Phylum, Class, Order, Family, Genus, Species.
Taxonomies details: Taxonomies section shows the taxonomy tree of the compound. The depth of the tree can be controlled in the search panel, described above.
Patents: Similar to the Pubmed section, this section shows the patents associated with the compound. By clicking on the title of the patent, you will be redirected to the associated page. Again, the number on the right indicates the number of times that this compound has been described in the patent. The three dots next to the number allow the user to see the abstract of the patent.
Obviously, all sections can be expanded and collapsed by clicking on the arrow on the right.
The other icon ![]() appears when there are experimental spectra from the GNPS database. If you click on this icon, you will be able to compare your spectrum with spectra of molecules that have the same molecular formula from real experiments. You can change experimental spectra using the arrows in you keyboard.
appears when there are experimental spectra from the GNPS database. If you click on this icon, you will be able to compare your spectrum with spectra of molecules that have the same molecular formula from real experiments. You can change experimental spectra using the arrows in you keyboard.
In the table on the top you can see the list of available spectra. For each spectrum, there is information about the ion source, the instrument used, the precursor, the ionization, and the mode; the export icon redirects you to the original web page where the spectrum comes from. You can also see the similarity between your spectrum and the ones from the GNPS database. Your spectrum as well as the selected experimental spectra are plotted in a head to tail plot.
In the left text entry boxes, you can select the number of peaks that you want to see as well as the accuracy that you allow when comparing with the experimental spectrum from the database. The mass power and intensity power are a way to make either the mass or the intensity more important when comparing with the experimental spectrum. The higher the power, the more important the information (intensity or mass) becomes. The similarity between two spectra is calculated based on the cosine similarity.
On the bottom left panel, you can select any experimental spectrum that was imported.
Similarity
For a low resolution spectrometer, this tool will calculate the similarity of each peak using the similarity parameters. For each proposition of the molecular formula, you can see on the right the graph with the theoretical and the experimental value. Here we can see in red the predicted value and in blue the experimental.
You can also specify a molecular formula and simulate it as following:
Fragments
This view is used to determine potential peaks due to the fragmentation of the molecule. The filter will be looking for subpart of the main molecule.
On the left panel, you can select the type of ionization as well as the accuracy (in ppm) between the experimental mass and the theoretical mass.
If you click on a peak, the system will show you on the middle table the potential molecular formula, depending on the accuracy that you provided. For instance, in the case of ethyl benzene with an accuracy of 50 ppm, it will show 3 molecular formula corresponding to the monoisotopic mass.
You can search within the table using the white cell on the top of each column. It is possible to filter by charge, unsaturation, exact mass...
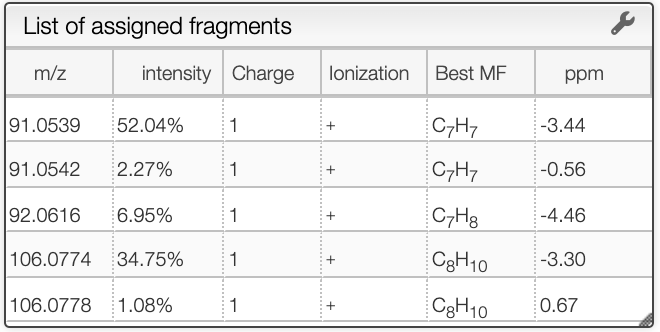
Once you clicked on a possible molecular formula, the system will be looking for monoisotopic masses of subpart of the main molecule and show them on the right table. In this example, the system found 5 possible fragments and show the charge, the MF, the ionization as well as the difference in ppm with the experimental peak.
All peaks
This module will analyze all the peaks and calculate the error with respect to the predicted spectrum of each molecular formula.
Mass DB search
Experimentally, it is not impossible that the sample is oxidized, a methyl group is added ... This tool will allow you to select peaks and search molecules that have the same fragments in a database.

In the preference panel, you can customize the search by specifying the number of peaks and the desired accuracy in ppm. Additionally, in the modification text entry, you can make changes to the molecular formula such as adding O, which will prompt the system to consider the possibility of an additional oxygen in the molecule. In the resulting table, you can see the structure of the relevant molecules, the type of modification that was considered, the similarity with respect to the experimental spectrum as well as the link to the GNPS database.