Mass spectra deconvolution
A mass spectrum is often complex and difficult to interpret, particularly when it contains multiple overlapping peaks or when there are uncertainties in the mass calibration. Mass spectra deconvolution is a computational technique that aims to extract meaningful information from a mass spectrum by separating the overlapping peaks and identifying the underlying species that give rise to the observed peaks. This can be achieved by comparing the observed mass spectrum to theoretical models of the expected isotopic distributions of the species in the sample. The tool takes as input a mass spectrum and generates all the theoretical isotopic distributions of all entities to look for. It then aligns the theoretical isotopic distribution to the centroids.
The workflow is the following:
- Make a peak picking (centroids) of the mass spectrum
- Generate all the theoretical isotopic distribution of all entities to look for
- Align the theoretical isotopic distribution to the centroids
- Calculate a non-negative matrix factorization
- Create a report
Physical principle
When analyzing a sample that contains multiple species that have the same ratio, the observed spectrum will be a superposition of the individual isotopic distributions of the species.

For example, molecule 1 has a mass and is charged , molecule 2 has two times the mass of molecule 1 and is charged . The observed mass spectrum will contain overlapping peaks since the mass-to-charge ratio is the same for both molecules. The only difference lies in the isotopic distribution of the peaks, where for example the distribution of will be different for the two molecules. The following documentation will describe in detail how the deconvolution algorithm works.
Mass spectrum deconvolution
Peak picking
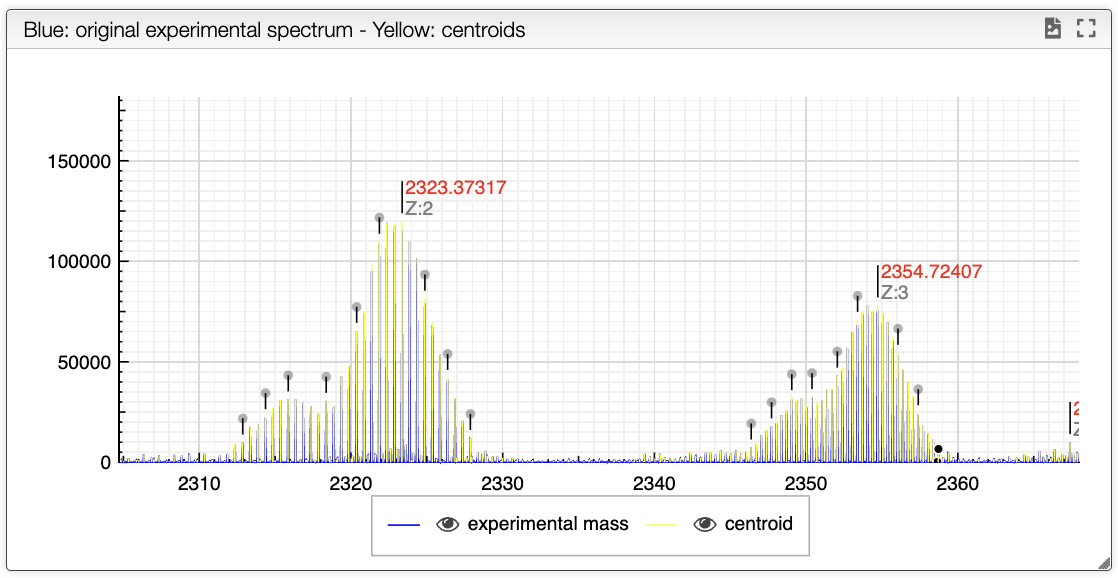
When loading the spectrum, a peak picking is done that determines the position and width of all the peaks based on a global spectrum deconvolution algorithm implemented in JavaScript.
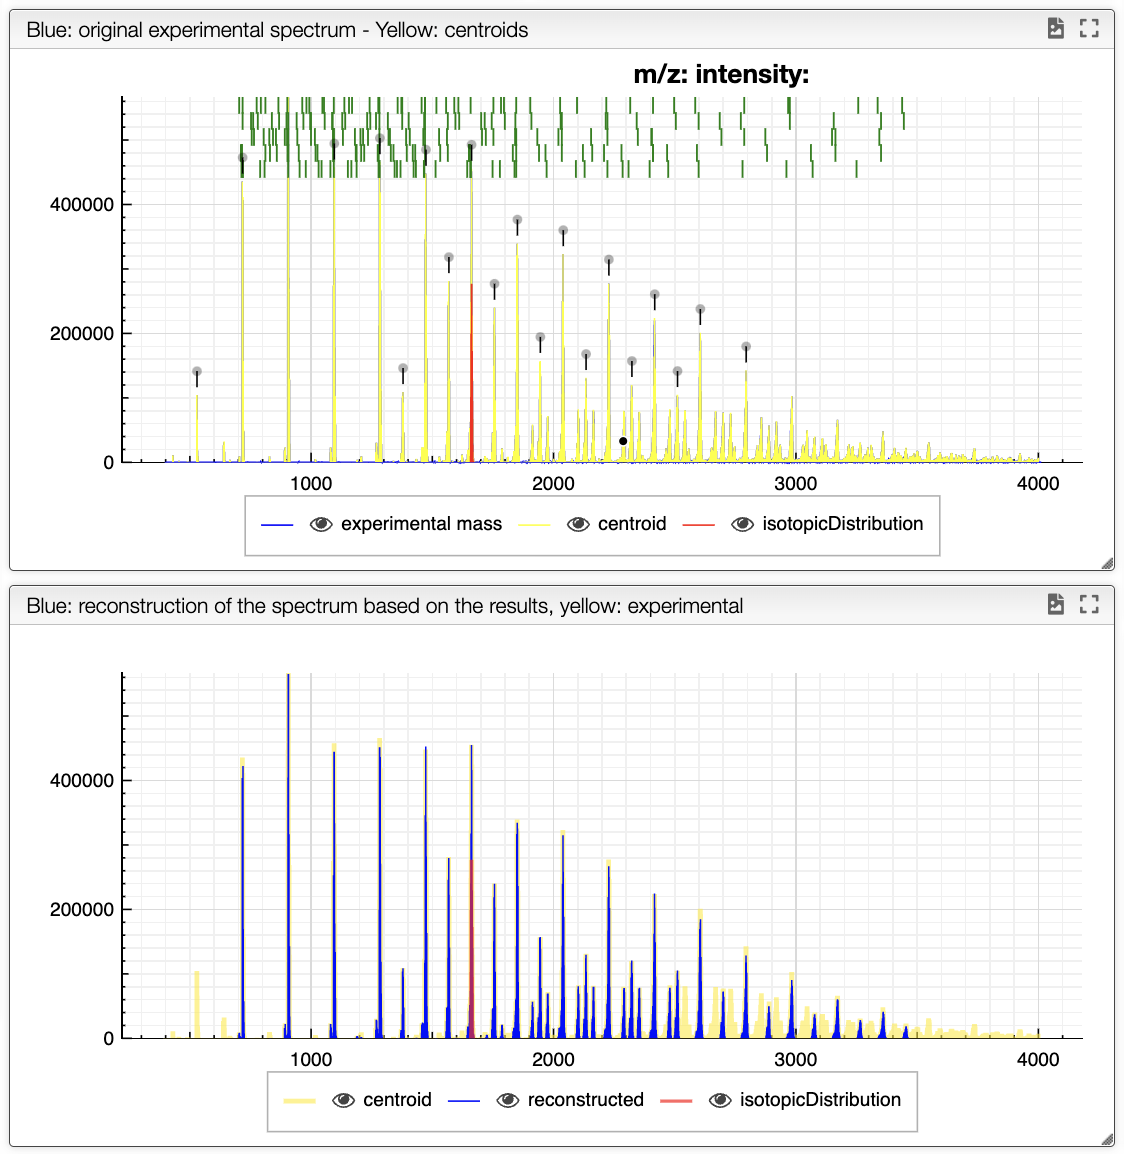
The result of the peak picking appears in the spectrum as yellow vertical lines. Note that the top of the peak is determined based on the 3 highest point and does not have to match an experimental point.
Define possible MFs
When trying to deconvolute a mass spectrum it is required to define all the possible molecular formula. It is important to limit as much as possible the number of molecular formula to consider.
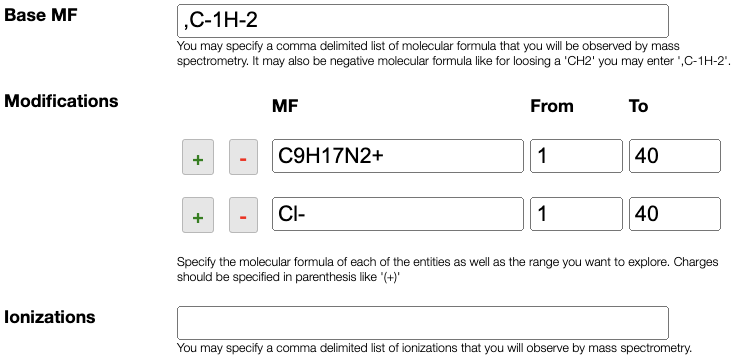
The molecular formula is defined based on:
Base MF: atoms that are common and present in all the molecular formulaModifications: list of modifications that can be applied on theBase MF- if you want to search for isotopic enrichment you can enter as MF:
C-1[13C], a modification in which we remove aCof natural abundance and add a 13C
- if you want to search for isotopic enrichment you can enter as MF:
Ionizations: define the list of ways to ionize the molecule. If the molecule is naturally charted this field may stay empty. It can also contain an unlimited comma separated list of ionizations likeNa+, K+, NH4+, H+,. Note this comma at the end that allows also to have no ionization.
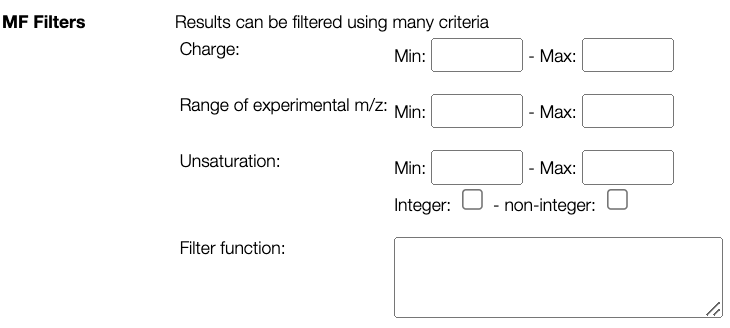
Possible MFs can be filtered based on DBE (double bond equivalent, unsaturation), charge and molecular weight. It is also possible to add more advanced filtering option by entering a JavaScript code that can use the following variables:
- mm: monoisotopic mass of the non ionized molecule
- mz: observed mass (m/z)
- charge: charge of the non ionized molecule
- unsaturation: unsaturation of the non ionized molecule
- atoms.O, atoms.C, atoms.N, ... number of atoms of the non ionized molecule
- examples:
- atoms.O < atoms.C
- mm < 500 && atoms.C > 10
Mass spectrum parameters
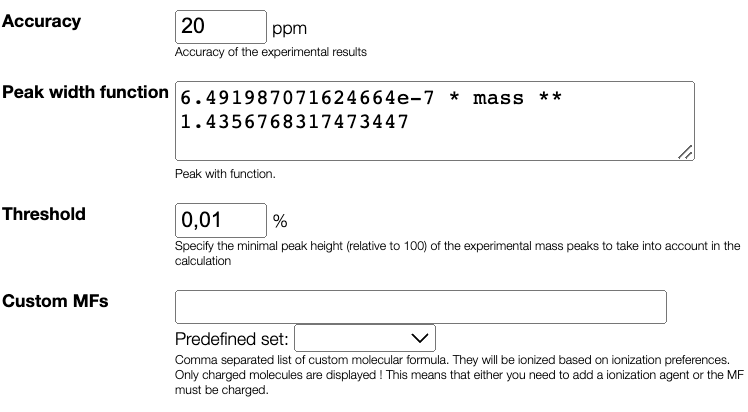
Peak width calculation is done automatically and allows to predict the peak width based on the mass.
In the peak width function box, you can find the predicted function of the width of the peaks depending on the mass.
Results table
After configuring the parameters, you can initiate the deconvolution process by clicking the Analyse the data button. The tool utilizes the non-negative matrix factorization algorithm to perform the deconvolution. The results of the deconvolution will be displayed in table panel on the right.
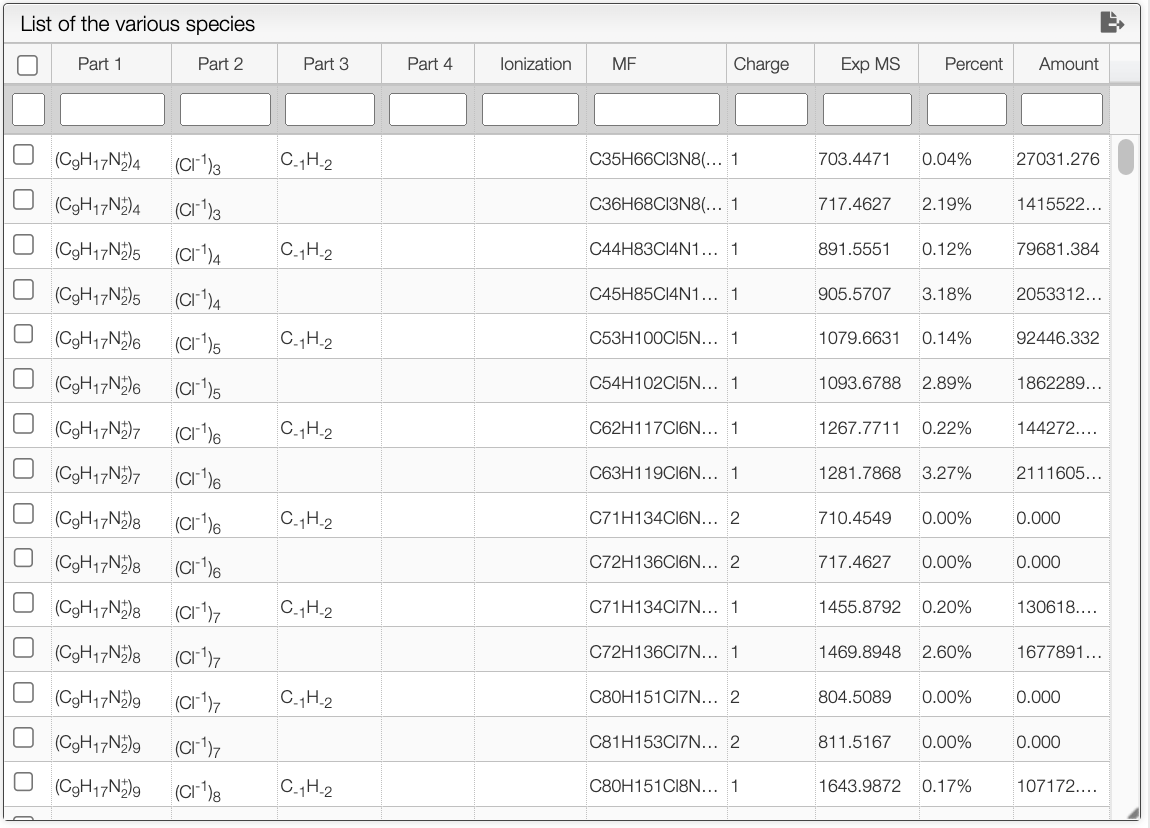
The table contains all the possible combinations of species that give rise to the experimental spectra. It provides information such as their molecular formula, charge, and product intensity in percentage. The table can be filtered by clicking on the headers or by entering filters in the white text boxes.
You can export the table as a txt file by clicking on the ![]() button. Once a row is selected, you can find a summary in the bottom right panel that includes the composition found as well as the observed mass.
button. Once a row is selected, you can find a summary in the bottom right panel that includes the composition found as well as the observed mass.
The blue spectrum displayed at the bottom represents the reconstructed spectrum, while the composition selected in the results' table is shown in red.
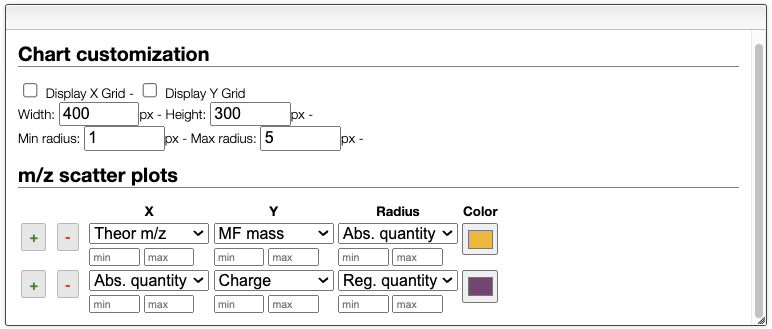
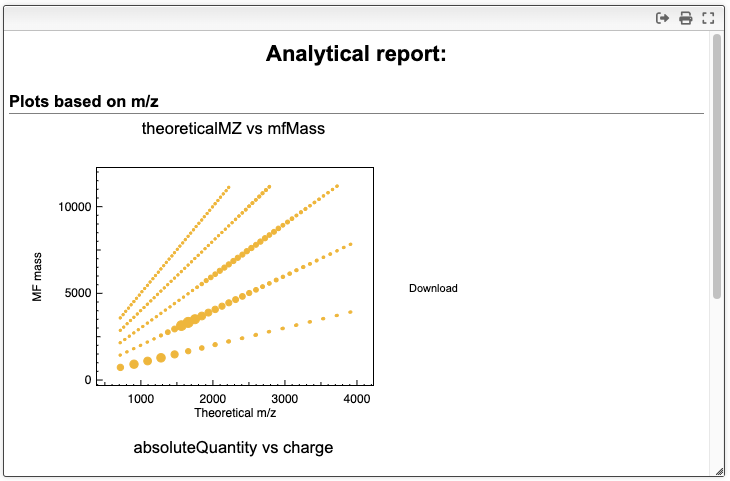
Report
The report tab allows you to generate plots of the results. You can select the suggested species that were calculated with the deconvolution algorithm to generate scatter plots. In the scatter plot settings, you can change the x and y-axis, as well as the color and size of the points. The + and - buttons allow you to add or remove scatter plots. The final report can be copied to the clipboard or saved as a pdf file.