Check HR mass
Introduction
This view allows you to simulate a high-resolution mass spectrum from a molecular formula. It can also be used to get the HR mass spectrum of a peptide or nucleic acid sequence.
HR mass
It is possible to predict the mass spectrum of a molecule by either drawing it on the left panel, entering the molecular formula, or entering a peptide or nucleic acid sequence in the corresponding area. Another possibility is to copy and paste a part of a pdb file that contains a sequence, this part will be automatically parsed and the sequence will be extracted.
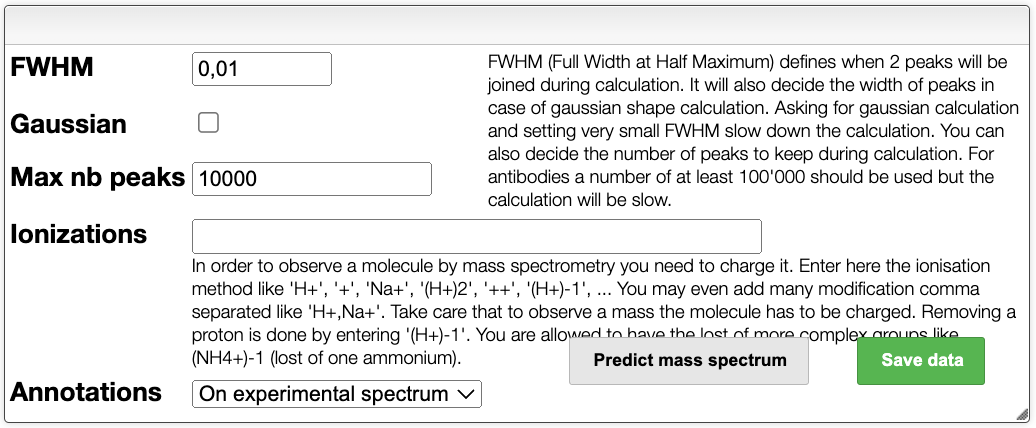
The spectrum is then predicted according to the settings given in the upper panel. In the settings, it is possible to modify :
- FWHM : the full width at half maximum of the peaks can be adjusted.
- Gaussian : enable or not a Gaussian peak shape.
- Max nb peaks : specify the maximum number of peaks.
- Ionizations : specify a single or multiple ionizations.
- Annotation : show the annotations on the experimental spectrum or the theoretical spectrum.
The spectrum can be predicted by clicking on the Predict mass spectrum button. It is also possible to save all data.
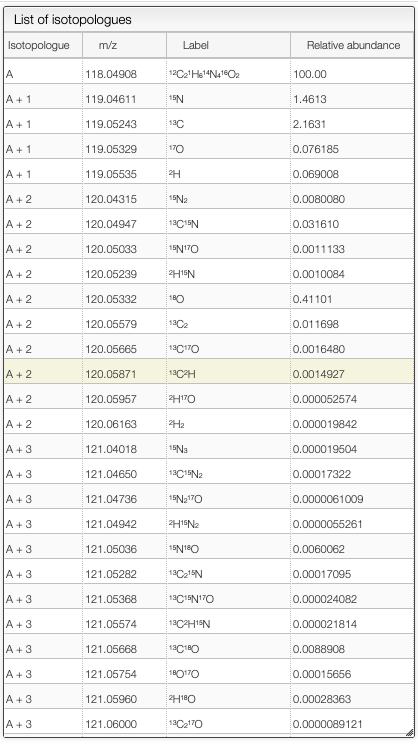
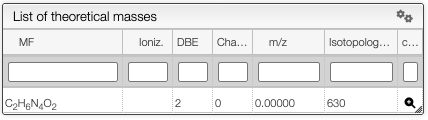
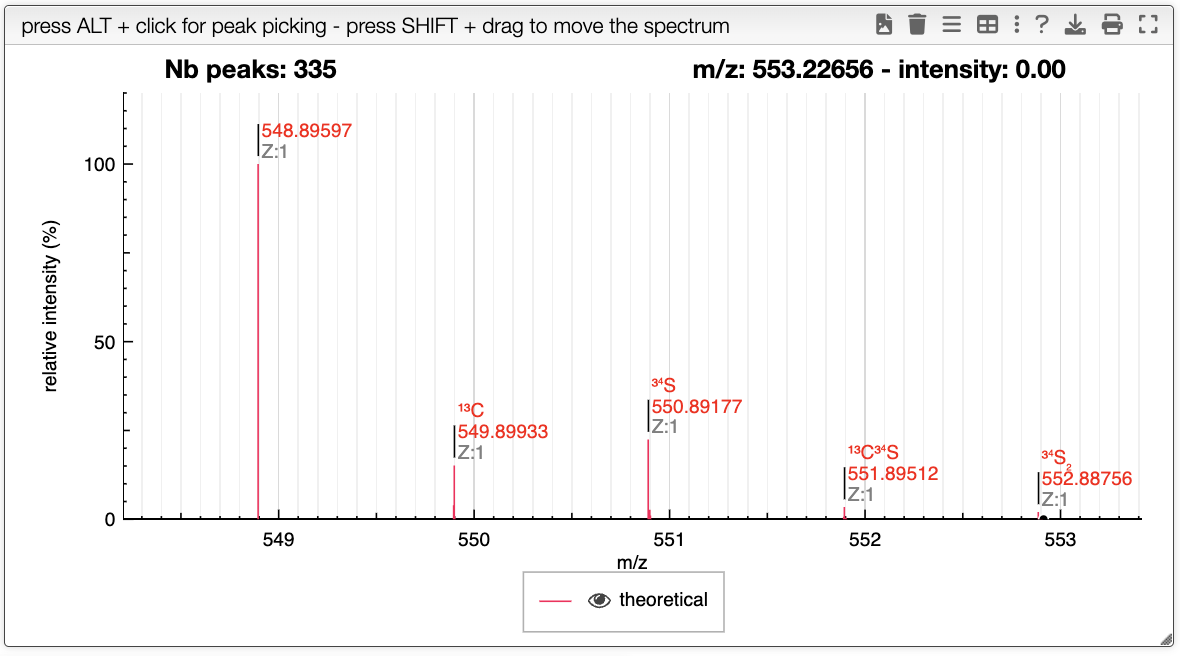
In the case where the FWHM is set to zero, and the peaks are non-Gaussian, if the annotation is on theoretical spectrum, the system will show the isotope that correspond to each peak. The system will show the list of theoretical isotopologues in the following table.
Then, the spectrum can be visualized in the central panel.
Experimental spectrum
You can drag and drop experimental spectrum on the top right panel. If you click on one experimental spectrum, it will be loaded and displayed. On the spectrum, if you press ALT and click on a peak, this peak will be added on the table on the right. Once you added one peak, you can assign it to any text.
On the right table, you will see the list of isotopologues. The table displays for each isotopologue its mass, m/z, label and relative abundance.