In silico fragmentation
This tool is an in silico fragmentation tool for small molecules. It uses a database of known fragmentation patterns to predict the most likely fragmentation pattern for a given molecule.
Preferences
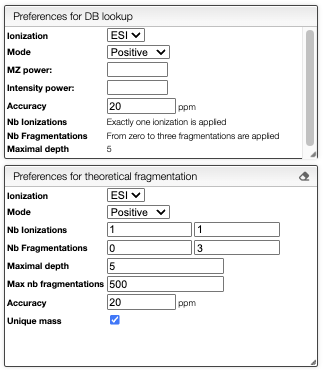
To compute the in silico fragmentation, the user needs to provide parameters in the left panel.
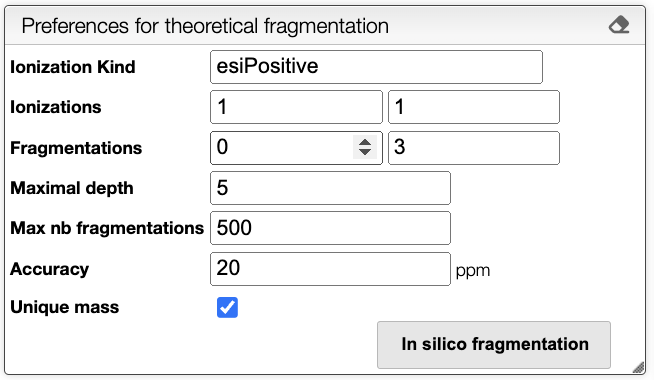
It is possible to choose the following parameters:
- Ionization Kind: Kind of ionization, currently only
esiPositiveis supported. - Ionizations: Range of ionizations to consider. The default is
1-1. - Fragmentations: Number of fragmentation mask to apply. The default is
0-3. - Maximum depth: Maximum depth of the fragmentation tree. The default is
5. - Max nb fragmentations: Maximum number of reactions to consider. The default is
500. - Accuracy: Accuracy in the mass in ppm. The default is
20. - Unique mass: If checked, only unique masses are considered. The default is
true.
Once all the parameters are set, the user can select a spectrum in the spectrum panel. If there is no spectrum, the user can upload one by drag and dropping a file in panel that is below the spectrum panel.
When a spectrum is selected, it will automatically be show in the bottom panel, and processed to label the peaks with the molecular formula associated. This annotation is based on the molecular formula of the molecule drawn in the bottom left panel.
Fragmentation
The fragmentation is computed by clicking on the In silico fragmentation button. The fragmentation tree is shown in the top panel.

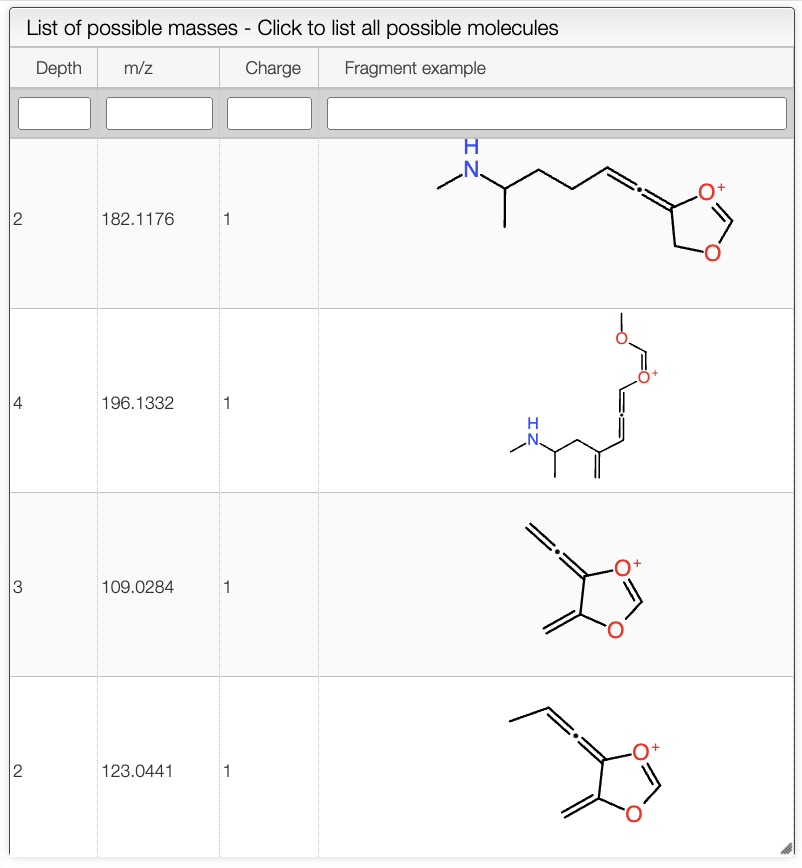
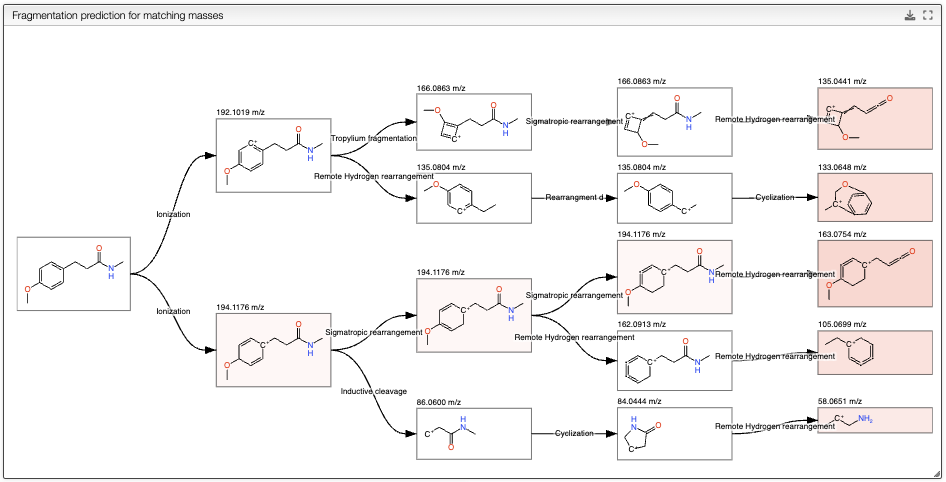
The resulting tree presents the initial molecule ionized, and the possible fragments of the molecule. The fragments are computed by applying a set of fragmentation reactions rules to the molecule from a database, that is accessible in the Reactions button on the top. The rules are applied recursively until the maximum depth is reached. It is important to note that only the fragments that have a mass that corresponds to a peak in the mass spectrum are kept. The intensity of the color of the fragments in the tree corresponds to the intensity of the peak in the spectrum, white meaning no peak, and pink the most intense peak. The tree can be exported as svg by clicking on the export button on the top right of the view.
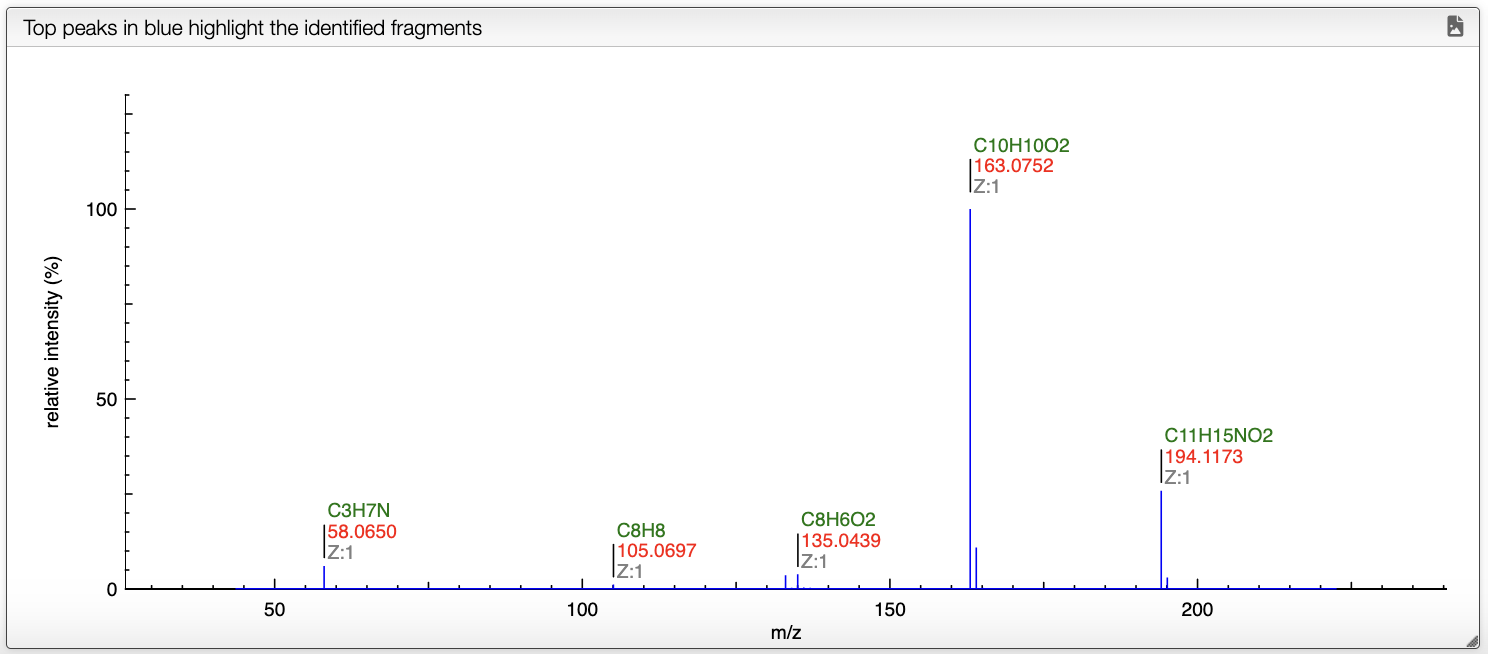
In the experimental masses panel, green cells correspond to the fragments that have been attributed to a peak in the spectrum.
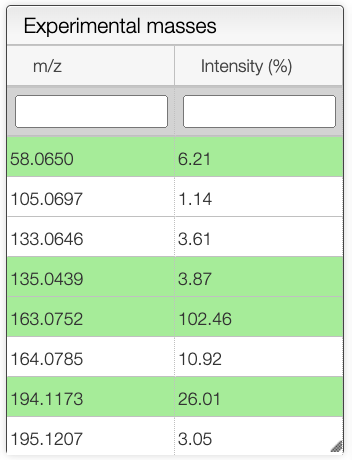
On the spectrum, the blue annotations correspond to the fragments that have been attributed to a peak.
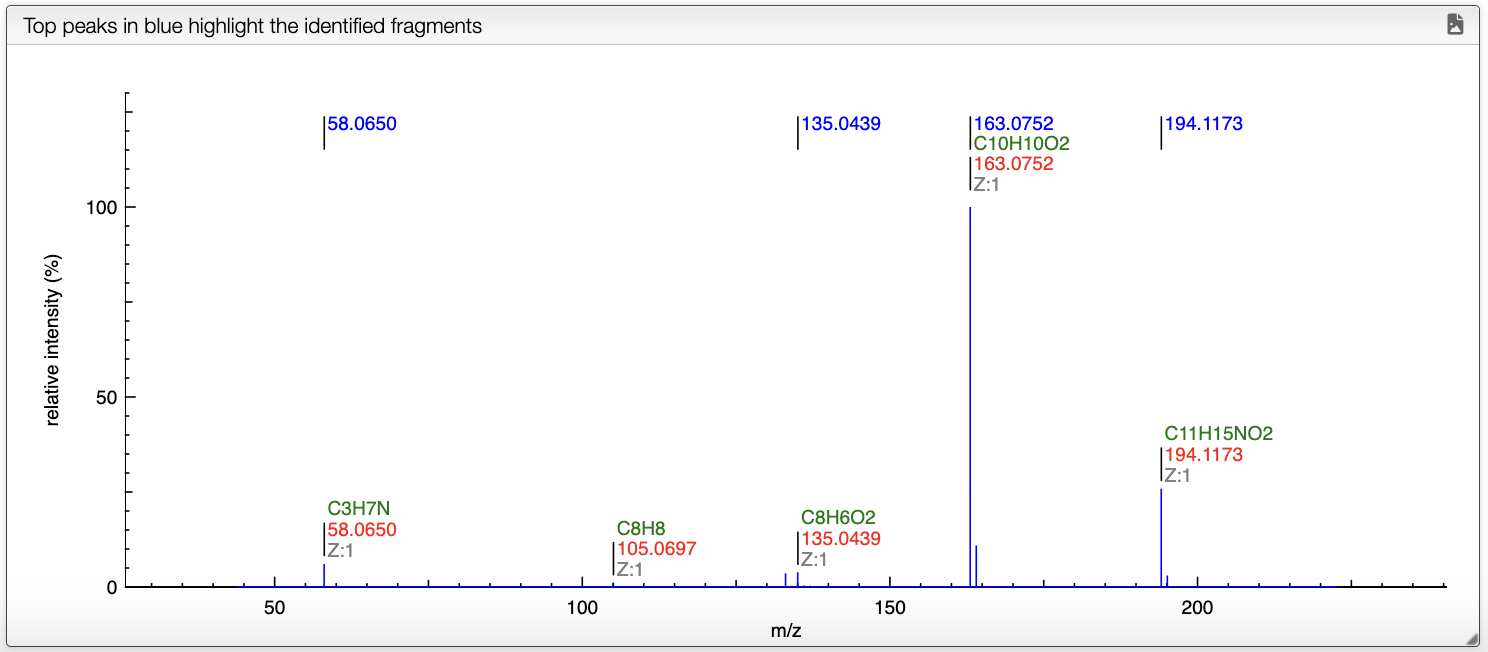
When the mouse is over a peak, the corresponding fragment is highlighted in the right panel view. Once a peak is clicked, the mass difference between all the other peaks is shown on the spectrum.
Explore peaks
The user can have a detailed view of the spectrum by clicking in the Explore peaks tab.
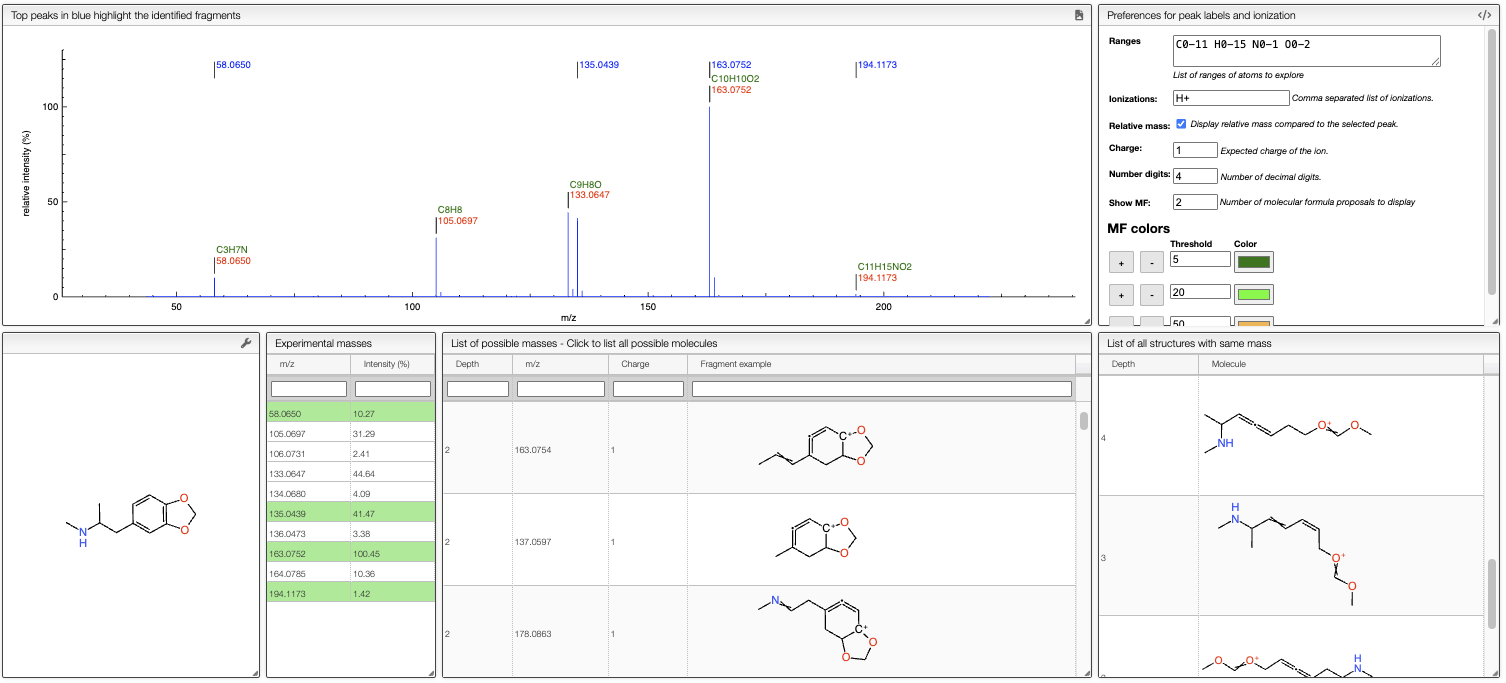
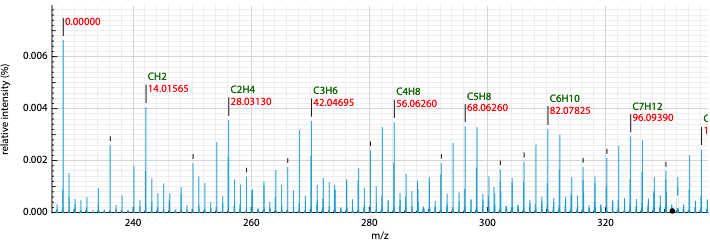
Annotation of the peaks in the spectrum.
Relative mass and MF determination
This view displays normally the mass of the peaks, but it is also possible to display relative mass to a specific peak.
- Click on a peak to change the
Monoisotopic massvalue - Click on the checkbox
Relative masson the top right
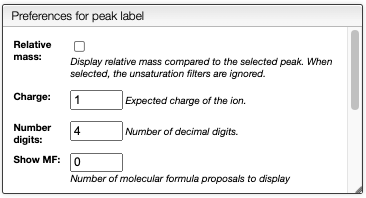
It is also possible to display possible molecular formulas for the relative mass. Those are calculating using the following criteria:
- allowed atoms are based on the
Ranges - only neutral loss are considered
- the charge of the entity loosing this neutral fragment is defined in
Charge, by default 1 - you should change the number in the cell
Show MFin order to annotate the peaks with the corresponding MF
It is also possible to define the color of the MF annotation depending on the precision. By default, if no MF is found under a precision of 20ppm no MF is displayed.
DB Search
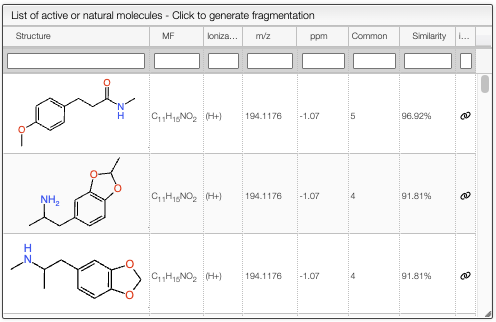
This tool allows to predict the fragmentation of a molecule in silico. First select a peak from the experimental spectrum. Then click on the Search in the database button, this will search in the octochemdb database for molecules that are bioactive or natural products. The results are shown on the left table.
Once a molecule is selected, the algorithm will perform a fragmentation in silico and show the fragmentation tree in the top panel.
The preferences for the DB search and the fragmentation can be set in the right panel.
Reactions
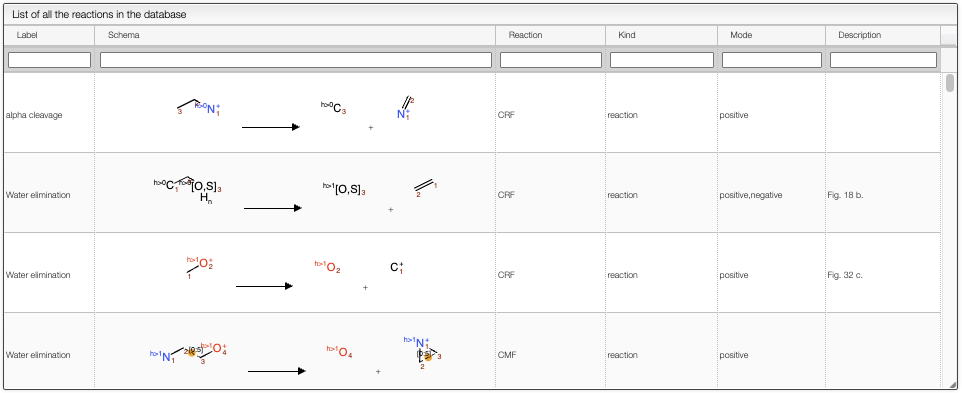
The Reactions view shows the list of reactions that are applied to the molecule to generate the fragments. The user can filter the reactions by Labels, Schema, Reaction, Kind, Mode and Description.
